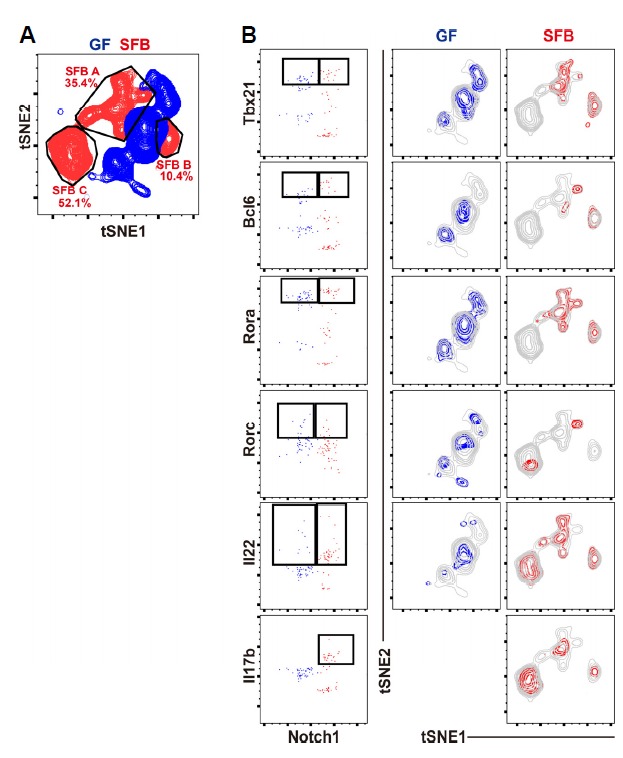
Fig. 3. tSNE analysis of in vivo generated SFB reactive CD4 T cells.

Data of Fig. 2 were further analyzed with FlowJo v10. t-distributed stochastic neighbor embedding (tSNE) analysis for 95 genes with −ΔCT values. (A) Distribution of donor T cells from GF (blue) or SFB-monocolonized (red) mice. (B) Distribution of single cells according to Tbx21, Bcl6, Rora, Rorc, Il22, or Il17b expression in the two-dimensional space.
