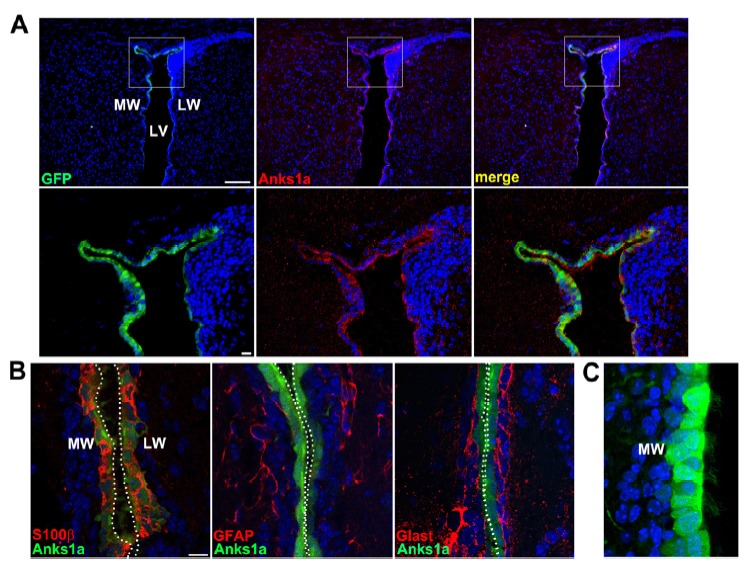
Fig. 2. Analysis of Anks1a expression using the BAC transgenic mouse line.

(A) The whole brains of Anks1a BAC transgenic mice at P20 were processed for cryostat sectioning. Coronal sections of the brains were subjected to immunohistochemical staining by using anti-Anks1a antibodies to analyze the co-localization of Anks1a with GFP. Scale bars, 200 μm for top panels and 25 μm for bottom panels. (B) Experiments were performed as described in panel A, with the exception that the Anks1a antibody was replaced with the indicated antibodies. GFP fluorescence represents Anks1a expression in this panel. (C) Ependymal cells with intense GFP signal show multi-cilia, suggesting that these are mature ependymal cells. Three independent trans-genic mice were analyzed and 8 adjacent sections on each slide were subjected to immunohistochemical staining. Scale bars for panel B and C, 20 μm.
