
Fig. 4. sh-PVT1 attenuated Ang II-induced AAA in mice.
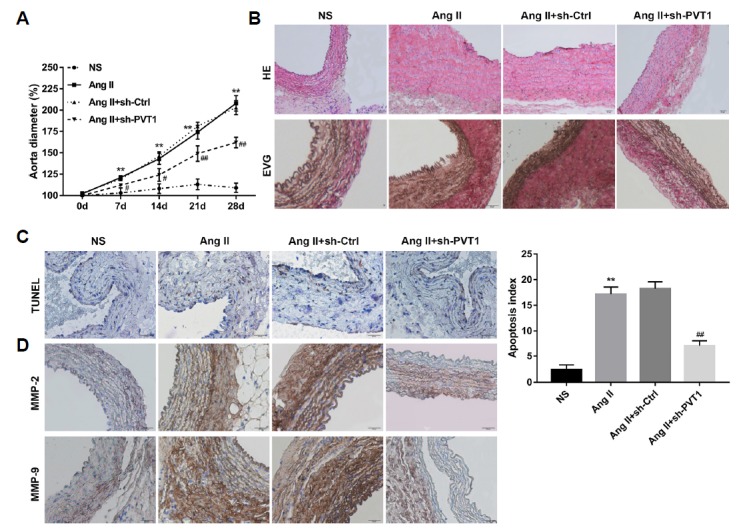
(A) Male ApoE−/− mice were randomly divided into four groups: NS, Ang II, Ang II + sh-Ctrl, and Ang II + sh-PVT1 groups. At days 0, 7, 14, 21, and 28 post-Ang II infusion, B-mode ultrasound imaging was conducted to measure the maximal external diameter of the abdominal aorta of the mice in each group. n=15 in each group. (B) Paraffin-embedded sections of abdominal aortas were stained with HE and EVG to evaluate the changes in aortic tissue structure and the damage of arterial wall elastic fibres, respectively. (C) TUNEL staining was performed to assess aortic cell apoptosis. The TUNEL-positive (brown) cells were counted in 10 randomly selected high-power fields, and the apoptosis index was calculated. (D) Representative images of immunohistochemical staining for MMP-2 and MMP-9 in each group. Scale bar: 20 μm. n=15 for each group. **P < 0.01 vs. NS group, and #P < 0.05, ##P < 0.01 vs. Ang II+sh-Ctrl group. NS: normal saline; Ang II: Angiotensin II; HE: haematoxylin and eosin; EVG: Elastica van Gieson; TUNEL: terminal deoxynucleotidyl transferase dUTP nick end labelling; MMP-2: matrix metalloproteinase-2; MMP-9: matrix metalloproteinase-9.