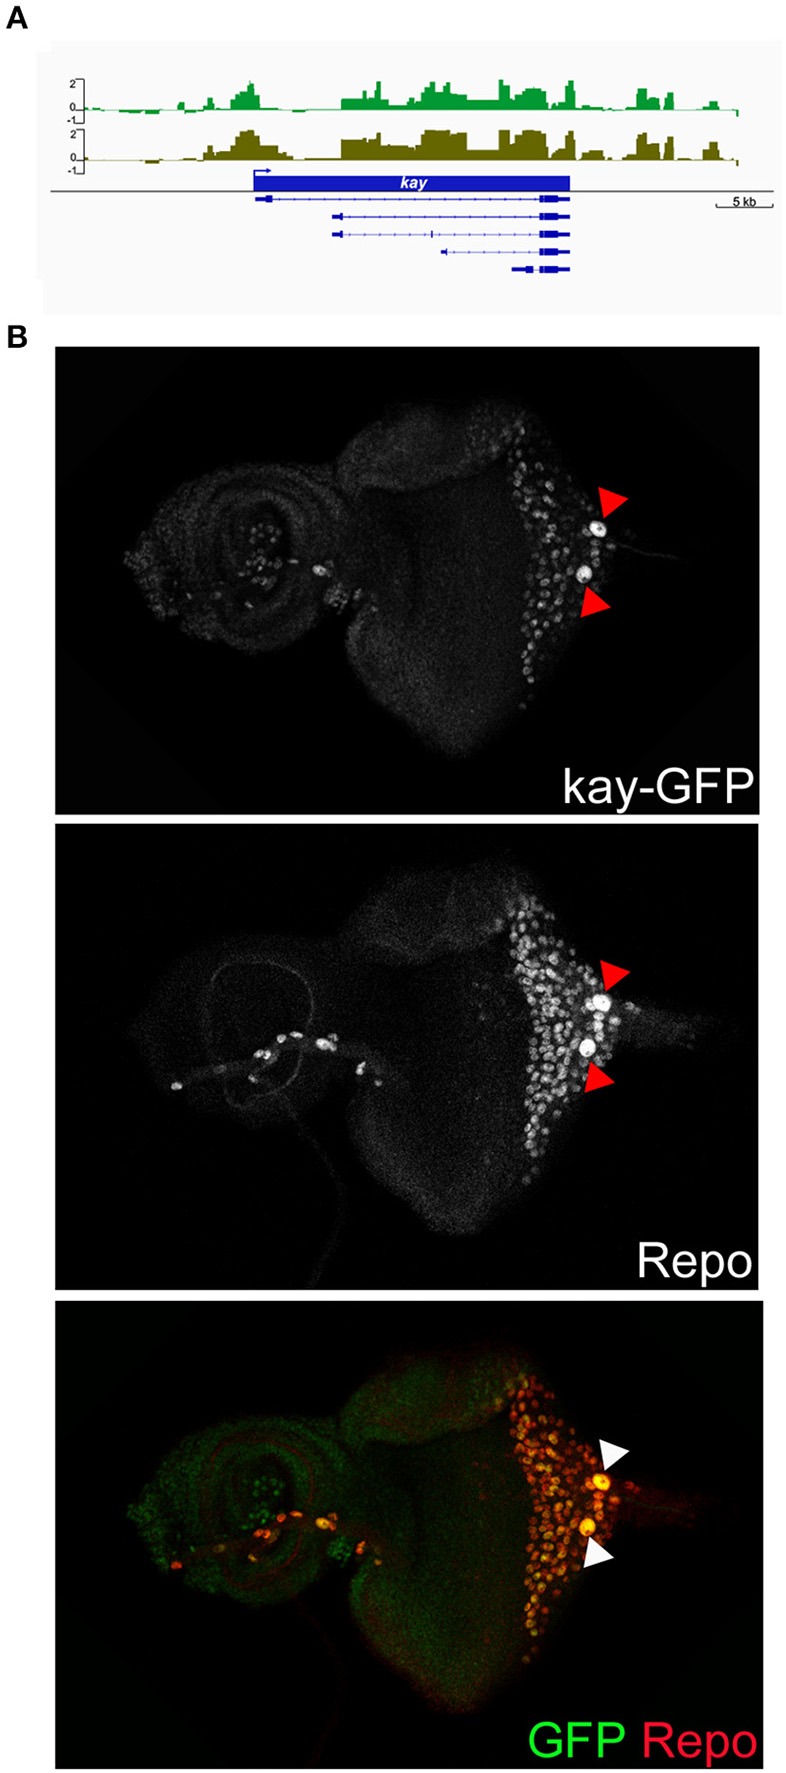
Figure 3.

Characterization of Dam-Pol II-bound kay. (A) Dam-Pol II occupancy in the kay locus. Both biological replicates are shown in light and dark green. Scale bars on the y-axis represent the log2 ratio change between Dam-Pol II and Dam samples. (B) Expression of GFP-tagged Kay protein. Larval eye imaginal disc stained for Kay protein (GFP staining, green) and glial nuclei (Repo staining, red). Red and white arrowheads indicate the carpet nuclei.
