Figure 4.
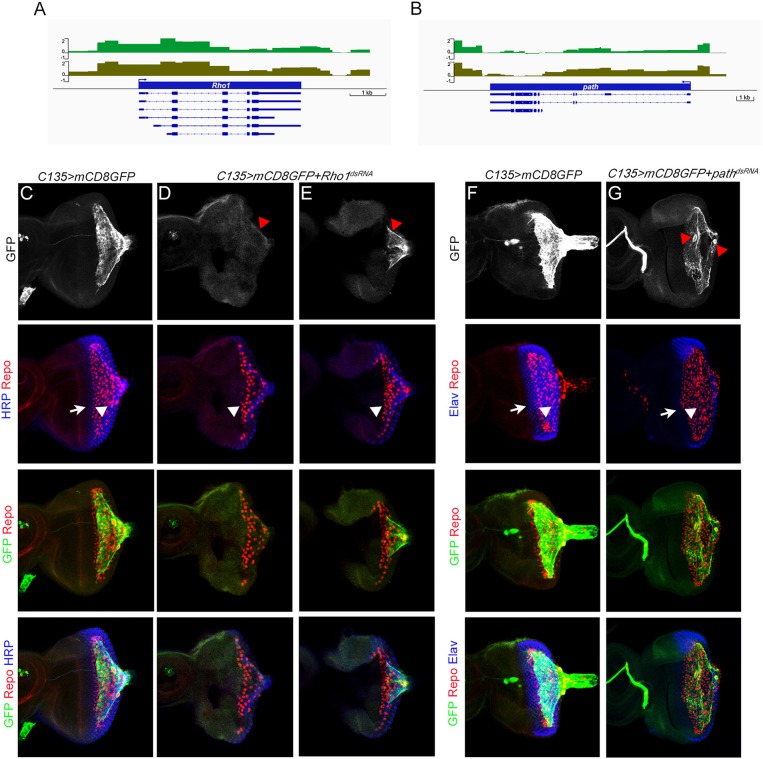
Characterization of Dam-Pol II-bound genes: Rho1 and path. (A,B) Dam-Pol II occupancy in the Rho1 (A) and path (B) loci. Both biological replicates are shown in light and dark green. Scale bars on the y-axis represent the log2 ratio change between Dam-Pol II and Dam samples. (C–E) All discs stained for the presence of carpet glia membrane (GFP staining, green), glial nuclei (Repo staining, red), and neuronal membrane (HRP staining, blue). (F,G) All discs stained for the presence of carpet glia membrane (GFP staining, green), glial nuclei (Repo staining, red), and differentiated PRs (Elav staining, blue). (C–G) The first row shows the membrane of carpet glia stained with GFP. Red arrowheads in (D,E) indicate the remaining membrane, and red arrowheads in (G) indicate the nuclei of carpet glia. The second row shows the relative position of the front of the PRs and that of the glia stained with HRP (C–E)/Elav (F,G) and Repo and indicated by white arrows and arrowheads, respectively. The third row shows the merged staining of Repo and GFP for the relative position between RBGs and the front of the carpet glial membrane, and the fourth row shows images merged with all staining. All images are z-projection of confocal sections.

