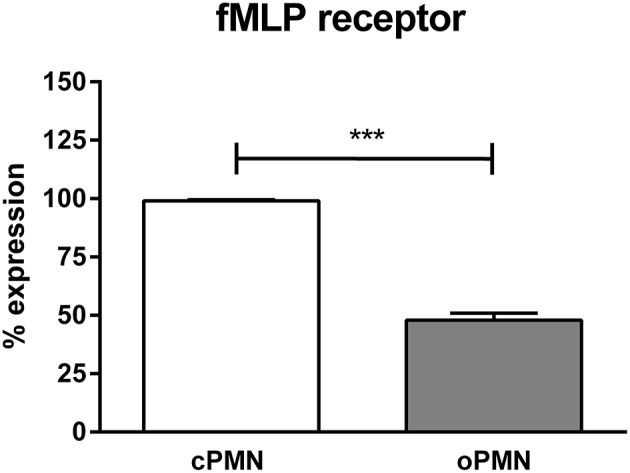
Figure 3.

fMLP receptor expression by cPMNs and oPMNs. Quantitative analysis of fMLP receptor expression (percentages) of cPMNs (white bar) and oPMNs (gray bar). The gating strategy as presented in Supplementary Figure 2 was followed. Data are presented as mean (+SEM) percentages of fMLP receptor expression of the live, CD16+ population. n = 3, ***p < 0.0005.
