Figure 6.

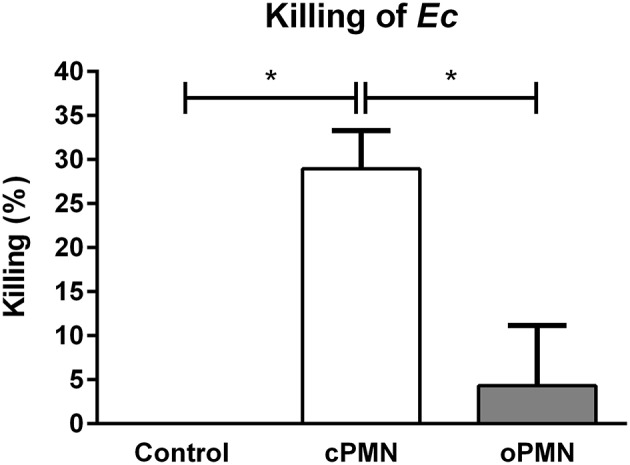
oPMN have a limited ability for intracellular killing of Ec. Quantitative analysis of killing capacity (percentages) of cPMNs (white bar) and oPMNs (gray bar). Percentages are based on the presence of CFU on overnight Ec agar plate assays. The control condition, representing 0% killing, was Ec incubated alone. On average, cPMNs killed 29 ± 4% while oPMNs killed 4 ± 7%. cPMNs killed significantly more Ec than both the control condition (p = 0.02) and oPMNs (p = 0.02). Data are presented as mean percentages (+SEM), n = 4, *p < 0.05.
