
Fig. 4.
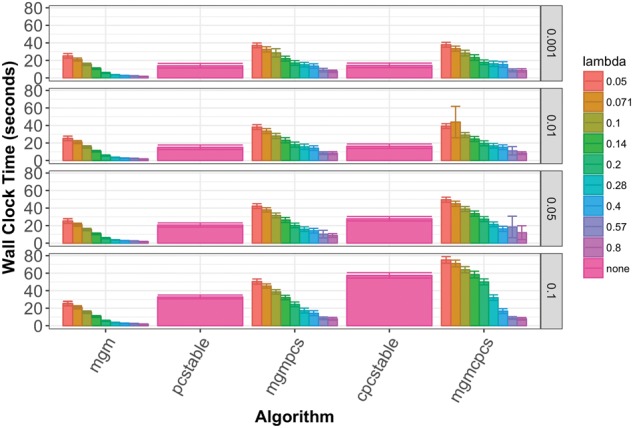
Average running times with 95% confidence interval error bars of search algorithms on high dimensional data. Each row of columns corresponds to a different setting of and each column corresponds to a different setting of λ. Directed search steps were run in parallel on a 4-core laptop