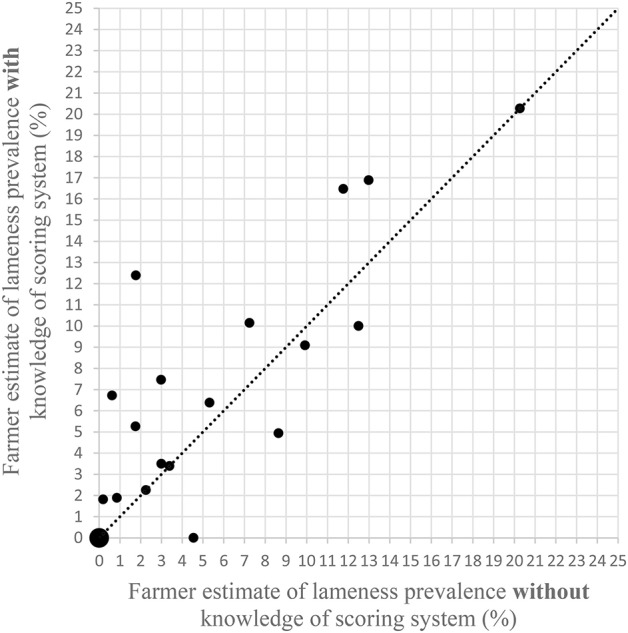
Figure 5.

Scatter plot of farmers' estimates of lameness prevalence on their farm before and after being shown the locomotion scoring system in Table 1. The line shows equivalence. Large data point represents the values of 3 farmers with overlapping responses.
