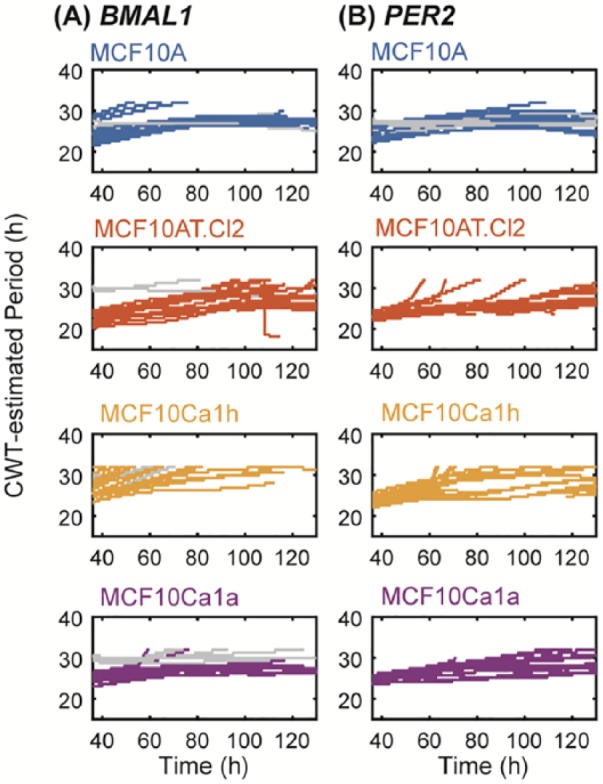
Figure 4.

Continuous wavelet transforms (CWT) estimate circadian periods for (A) BMAL1 and (B) PER2 over time. Shown are Morlet-wavelet estimates of the period of oscillation for each cell line and reporter (blue for MCF10A, orange for MCF10AT.Cl2, yellow for MCF10Ca1h, and purple for MCF10Ca1a). The periods of outlier time series are shown in gray.
