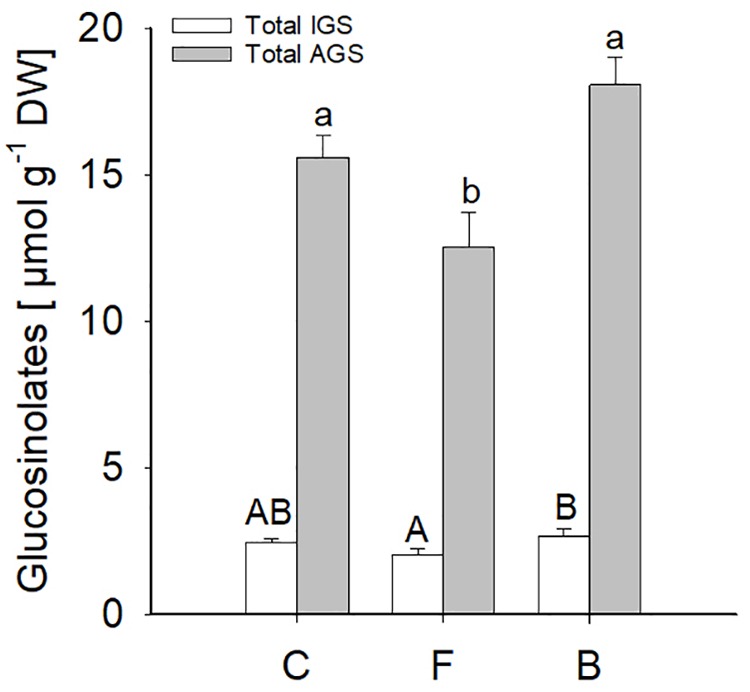
Figure 8.

Indole (white bars) and aliphatic (grey bars) glucosinolate levels (means ± SE) measured in B. bassiana colonised (F, FRh2 and B, BG11) and control (C) A. thaliana leaves. Error bars represent the standard error of the mean (N = 6), bars with different letters differ significantly, (P < 0.05).
