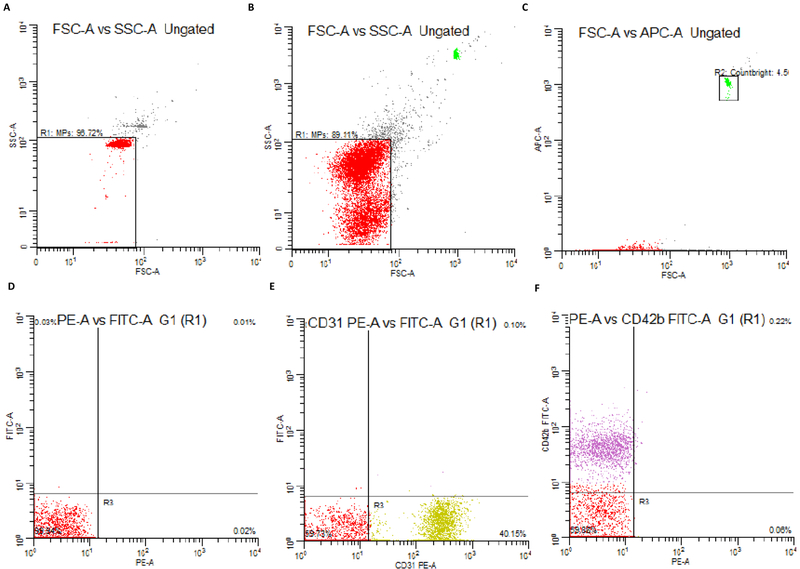
Figure 1.
Examples of gating strategies for flow cytometry analyses. a-b) NIST beads are used to create gates which delineate events <1.0 μm c) Countbright beads are used to ensure a consistent number of events for each sample and are used to calculate MP concentration. d) unstained controls, e) PE color control and f) FITC color controls

