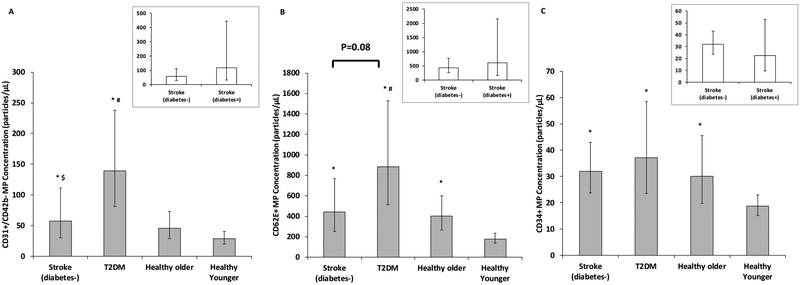
Figure 3.
Comparison of a) CD31+/CD42b-, b) CD62E+ and c) CD34+ microparticle (MP) concentrations in chronic stroke(diabetes-) (n=10), type 2 diabetes mellitus (T2DM)(n=17), and healthy older (n=17) and younger individuals (n=17). Inset figures represent comparison between chronic stroke(diabetes+) (n=7) and chronic stroke(diabetes-) (n=10). Raw data are presented but were log-transformed for analyses. Figures represent mean and 95% confidence limits. * indicates significantly different than healthy younger adults (P<0.05); # indicates significantly different than healthy older adults (P<0.05); $ indicates significantly different than T2DM (P<0.05)

