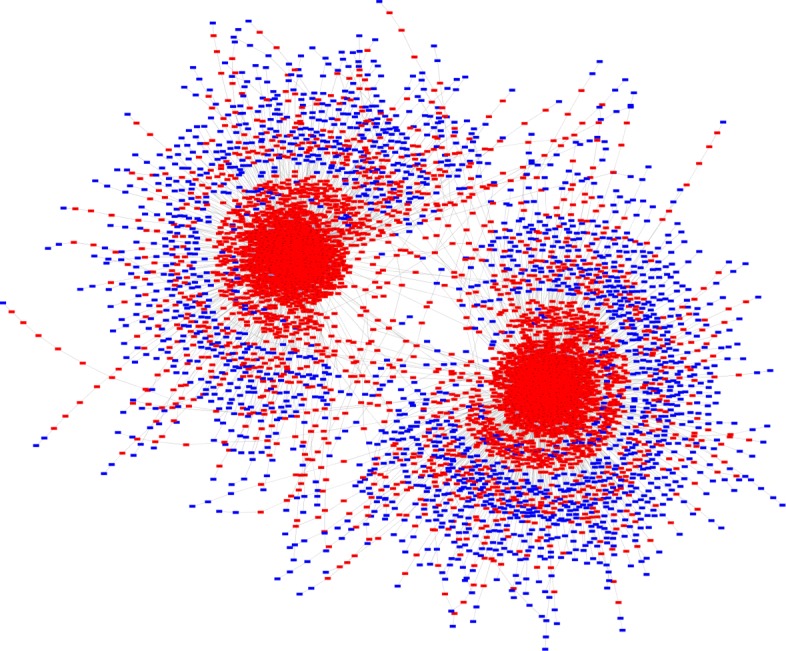
Fig. 3.

State Transition Graph 1. State transition graph obtained by simulating our proposed Boolean network model using input signal condition given in Case 8 of Table 4. Simulations generate 2 attractors, both having the Apoptosis node activated. Apoptosis is ON in the red coloured states and OFF in the blue colored states
