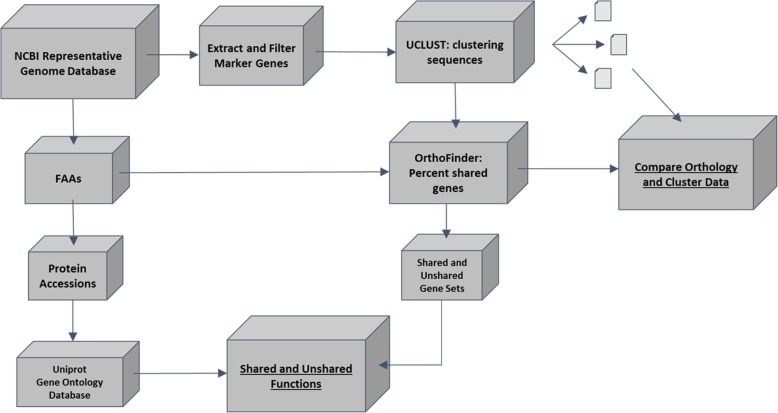
Fig. 1.
Workflow of data analysis. The workflow for analysis starts at the upper left box “NCBI Representative Genome Database” and follows two majors tracks. The first leads to a comparison between bacterial genome orthology (determined by Orthofinder) and marker gene sequence cluster groups (determined by UCLUST). The second path utilizes the protein-coding gene sets to determine which functions are shared or unshared across the bacterial genomes. Arrows correspond to the movement of data through the pipeline

