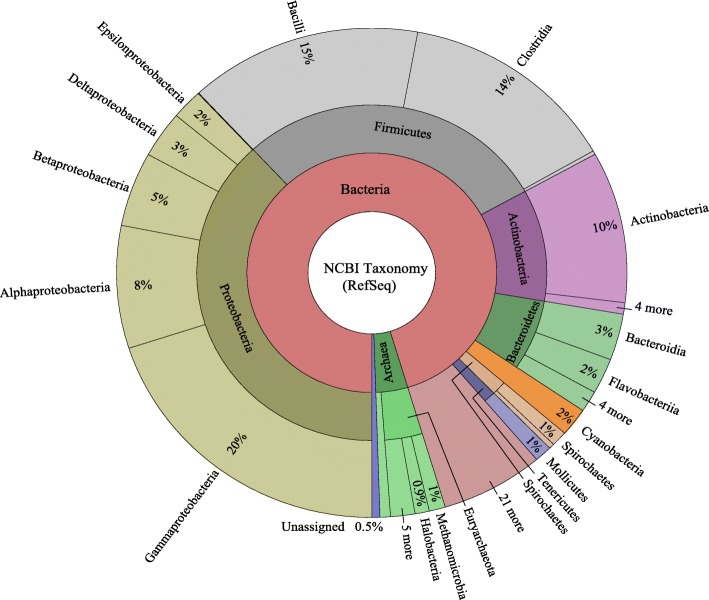
Fig. 2.
Taxonomic classifications of NCBI’s RefSeq representative prokaryotic genomes. A KronaTool map representing the relative taxonomic breakdown of the genomes used in this study. The inner circle represents genomes at the domain, the middle circle corresponds to phylum, and the outer circle represents data at the class level

