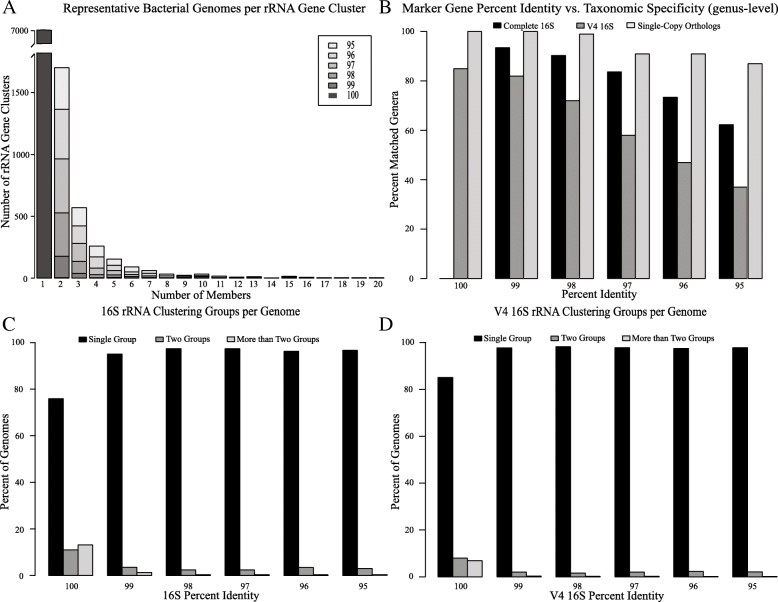
Fig. 4.
16S rRNA clustering statistics. a The relationship between the number of 16S rRNA clustering groups and the number of bacterial genomes represented in each cluster at various percent identity thresholds. b Taxonomic resolution (genus level) based on clustered marker genes for each of the three amplicon datasets. c and d The percentage of genomes whose 16S rRNA genes clustered into one, two, or greater than two different clustering groups for the 16S rRNA and V4 16S rRNA datasets respectively

