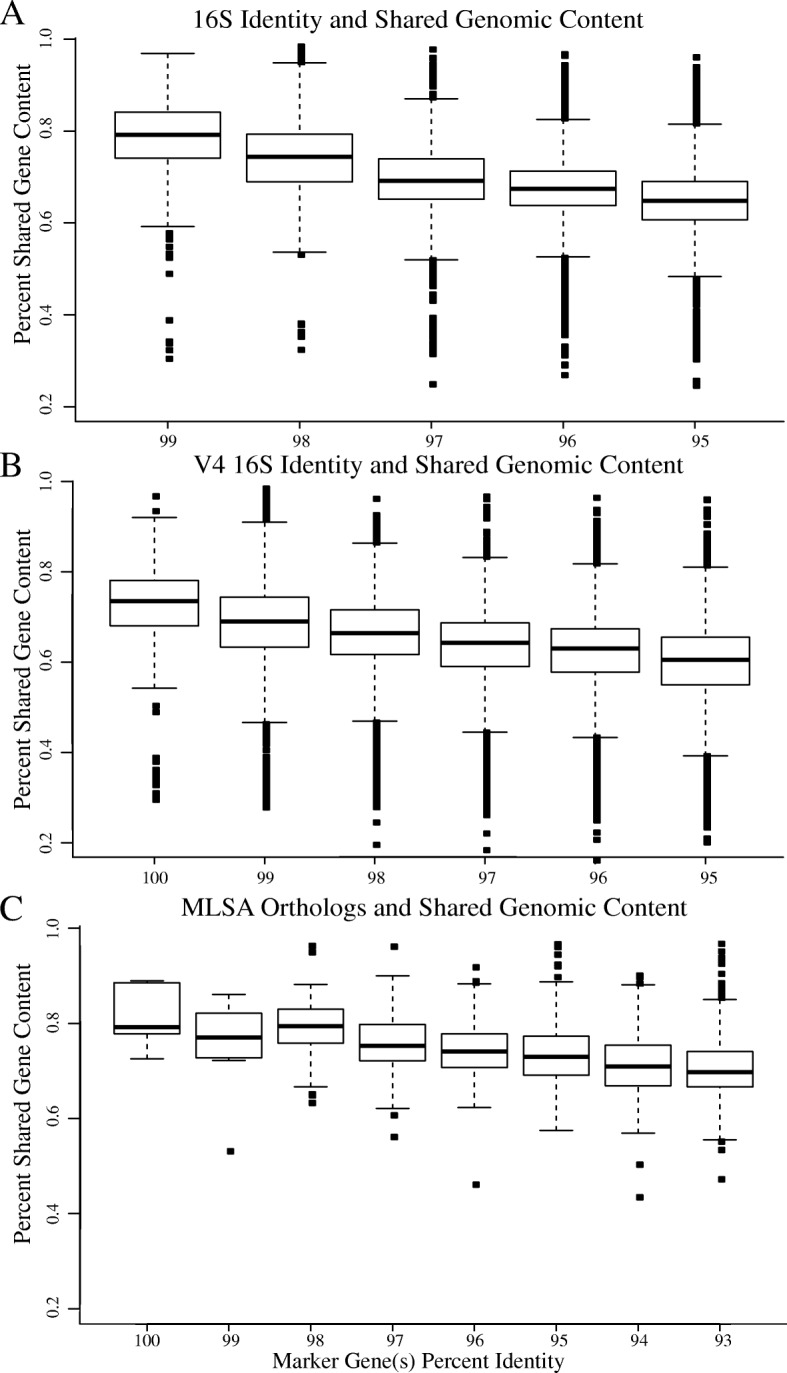
Fig. 5.

Phylogenetic marker(s) and single-copy ortholog(s) relationship to shared gene content. Shown are box and whisker plots depicting the percentage of shared genes between genomes clustered at various percent identity intervals: (a) 16S rRNA, (b) V4 16S rRNA, (c) Five-concatenated MLSA orthologs. Boxplots show the first and third quartile (bottom and top lines of the box), the median (middle line of the box), and the smallest and largest data-points excluding outliers (bottom and top whiskers). Data-points outside the whiskers correspond to outliers
