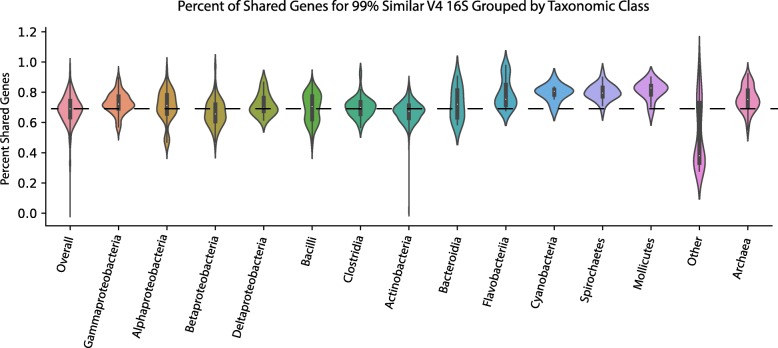
Fig. 6.
Relationship between 99% similar V4 16S rRNA and shared gene content across select microbial lineages. Violin plots representing the distribution of phylogenetically identical organisms (99% V4 16S rRNA) across select microbial lineages and the percentage of shared gene content. The dotted black line corresponds to the mean shared gene content of the entire dataset and the width of the violin represents the relative concentration of data (i.e. wider regions contain more data points)

