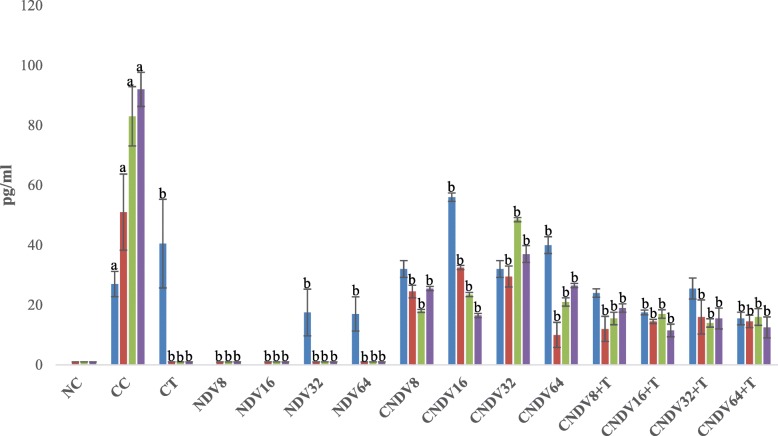
Fig. 4.
Number spots of IL-10 (in pg/ml) in different groups of mice throughout four weeks experiment. NC: Normal Control; CC: Cancer Control; CT: Cancer + Tamoxifen; NDV: NDV virus alone; CNDV: Cancer and treated with NDV virus; CNDV + T: Cancer and treated with NDV and Tamoxifen. a p < 0.05 compared with NC; b p < 0.05 compared with CC

