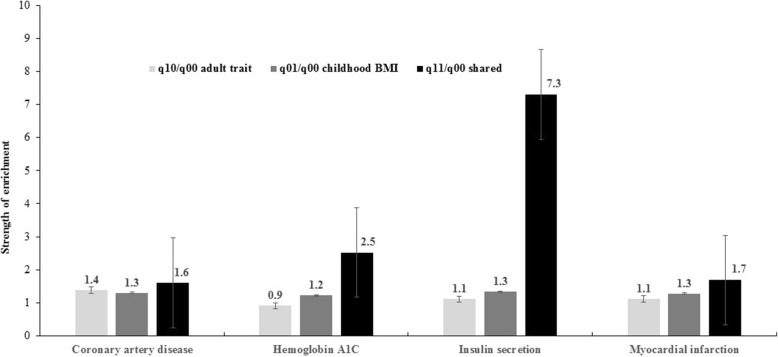
Fig. 1.
Enrichment of functional annotations for variants associated with childhood BMI and adult cardiometabolic traits. Vertical lines crossing the bars represent standard error. q01/q00, q10/q00, and q11/q00 represent the ratio of the probability of SNPs associated with adult traits, child traits, and both traits, respectively, being functionally annotated to the probability of a null SNP being functionally annotated

