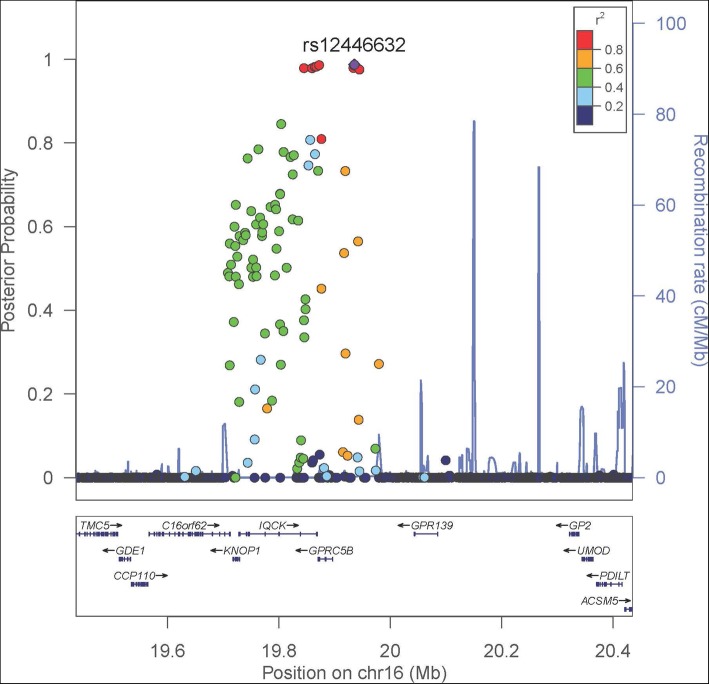
Fig. 3.
Regional association plot of the GPRC5B-GPR139 locus significantly associated with childhood BMI and adult HDL cholesterol. Data span 500 kb centered at the index SNP rs12446632. The x-axis denotes genomic position and the y-axis denotes the posterior probability of association and recombination rate (cM/Mb). The purple circle point represents the index SNP. The color of each data point indicates its linkage disequilibrium value (r2) with the index SNP based on HapMap2

