Fig. 3.
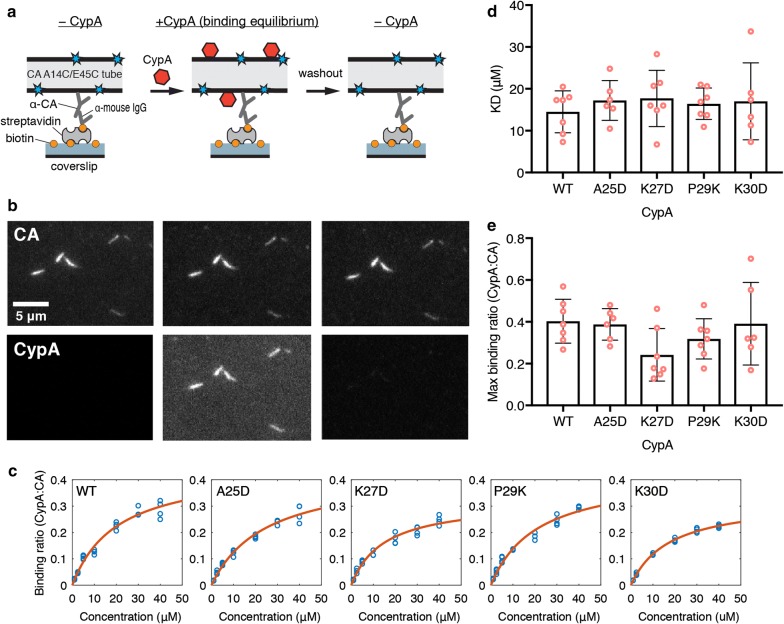
TIRF microscopy analysis of wild type and mutant CypA binding to cross-linked CA tubes. a Schematic diagram of the TIRF microscopy binding assay using cross-linked CA tubes assembled inside the flow cell from CA A14C/E45C and CA K158C-AF488 (20:1, mol/mol) and immobilized on the surface via an antibody. AF647-CypA injected into the flow cell co-localises with the tubes upon binding. b TIRF images of the capsid channel (top) and CypA channel (bottom) before CypA addition (left), in the presence of CypA (middle), and after CypA washout (right). c Representative equilibrium binding curves of the interaction of wild type or mutant CypA and CA tubes determined by TIRF microscopy. Each symbol represents the mean ratio determined for all tubes in a field of view. d, e Dissociation constants (KD) (D) and maximum CypA:CA molar binding ratios (E) determined from fits of equilibrium binding curves for wild type and mutant CypA. Each symbol represents an independent experiment. d The KD values were estimated to be 14.5 ± 5 μM (WT), 17.2 ± 4.8 μM (A25D), 17.7 ± 6.7 μM (K27D), 16.4 ± 3.8 μM (P29K) and 17 ± 9.2 μM (K30D) (mean ± SD, n ≥ 6). P ≥ 0.86 between CypA WT and mutants (one-way ANOVA). e Maximum binding ratios of CypA binding with CA tubes (molar ratio of CypA:CA when saturated) were estimated at 0.40 ± 0.11 (WT), 0.39 ± 0.08 (A25D), 0.24 ± 0.13 (K27D), 0.32 ± 0.10 (P29K) and 0.39 ± 0.20 (K30D) (mean ± SD, n ≥ 6). P ≥ 0.15 between CypA WT and mutants (one-way ANOVA)

