Fig. 3.
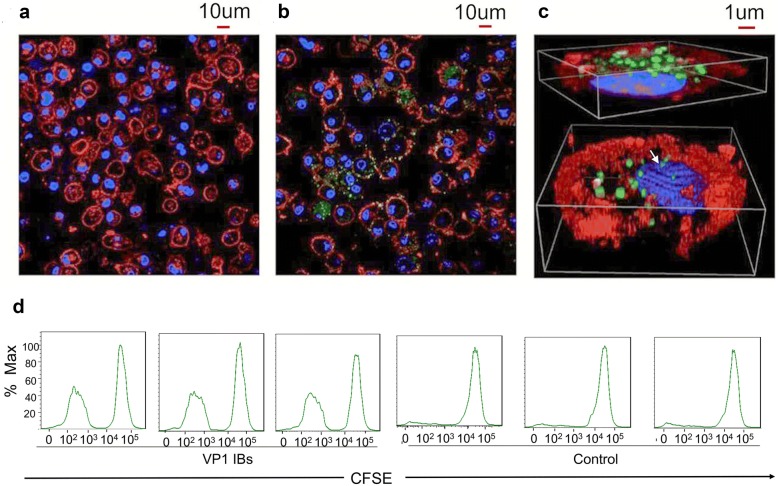
Uptake of VP1 IBs by BMDCs and T cell proliferation assay in vitro. Confocal microscopy image of BMDCs in absence (a) and in presence (b) of FITC-labeled VP1 IBs. c XYZ overlay confocal image of FITC-labeled VP1 IBs uptake by BMDCs, showing intracellular penetration of VP1 IBs. Nuclear membrane is seen in blue and cell membrane in red, VP1 IBs are seen in green. d Representative flow cytometry histograms of CFSE-labeled T cells show increased proliferation capacity when cultures in the presence of BMDCs loaded with the VP1 IBs, compared to control

