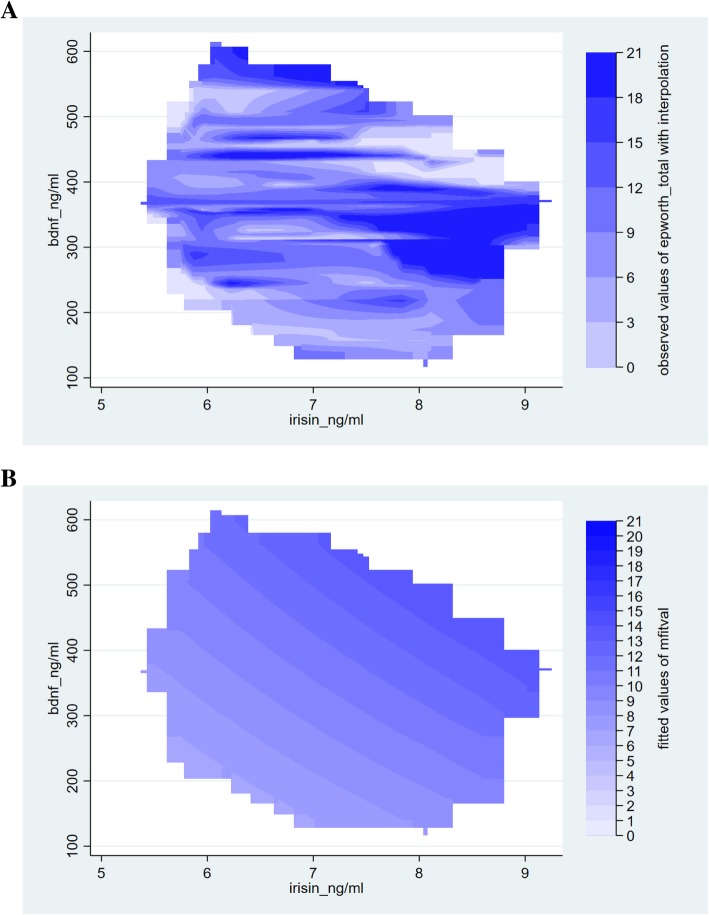
Fig. 2.
Association between Epworth Sleepiness Scale scores and serum irisin and BDNF levels. Panel A shows the observed values of ESS (axis z) as a function of serum irisin and BDNF using interpolation within data coverage limits, while Panel B is a contour map of fitted values of ESS as predicted by a multiple regression model with interaction between irisin and BDNF

