Fig. 5.
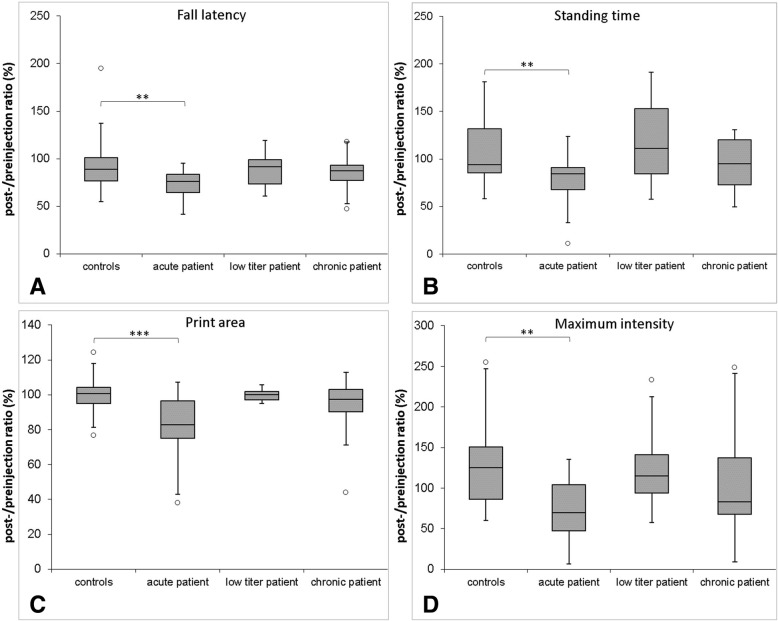
Box plots of parameters of motor testing. The y-axis gives the values after injection in relation to pre-testing values (in %). Fall latency measured by rotarod is decreased in animals injected with IgG of the acute patient (a). Catwalk gait analysis reveals decreased standing time, print area and maximum intensity of the right hind paw in animals injected with IgG compared to controls (b–d). The boxplots show medians and quartiles; circles represent outliers. (*0.1 > p > 0.01, **0.01 > p > 0.001, ***0.001 > p)

