Figure 4.
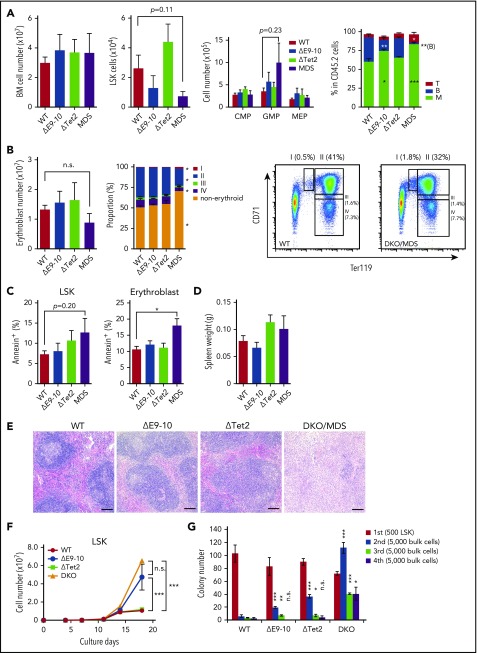
Concurrent deletion of Bcor and Tet2 induces inefficient hematopoiesis. (A) Absolute numbers of total BM cells, CD150+CD34−LSK HSCs, LSK HSPCs, and myeloid progenitors in a unilateral pair of the femur and tibia from moribund DKO MDS mice (n = 6) and their controls in the same cohort (WT, n = 5; ΔE9-10, n = 5; ΔTet2, n = 5). Proportions of myeloid, B and T cells in BM are shown in the right panel. *P < .05; **P < .01; ***P < .001 by the Student t test. (B) Absolute numbers of BM erythroblasts in a unilateral pair of the femur and tibia from moribund DKO MDS mice (n = 5) and their controls in the same cohort (WT, n = 5; ΔE9-10, n = 5; ΔTet2, n = 5). Proportions of the differentiation stages of erythroblasts and a representative flow cytometric profile of WT and DKO MDS erythroblasts are shown in the middle and right panels. *P < .05 relative to WT by 1-way analysis of variance, Tukey’s post hoc test. (C) Percentage of annexin V+ cells in LSK cells and CD71+Ter119+ BM erythroblasts in moribund DKO MDS mice (n = 5) and their controls (WT, n = 5; ΔE9-10, n = 5; ΔTet2, n = 5). *P < .05 by the Student t test. (D) Spleen weights of moribund DKO MDS mice (n = 6) and their controls (WT, n = 5; ΔE9-10, n = 5; ΔTet2, n = 5). (E) Histology of the spleen from WT, ΔE9-10, ΔTet2, and DKO MDS mice observed by hematoxylin-eosin staining. Bars represent 100 μm. (F) Growth of WT, ΔE9-10, ΔTet2, and DKO LSK HSPCs in culture. LSK cells purified from mice 1 month after the tamoxifen injection were cultured in triplicate under myeloid cell culture conditions (SCF + TPO + IL-3 + GM-CSF). ***P < .001; n.s., not significant, by the Student t test. (G) Replating assay data. Five hundred LSK cells were plated in methylcellulose medium containing 20 ng/mL of SCF, TPO, IL-3, and GM-CSF. After 12 days of culture, colonies were counted and pooled, and 5 × 10³ cells were then replated in the same medium every 7 days. Data are shown as the mean ± SEM. Statistical significance is shown relative to WT. *P < .05; **P < .01; ***P < .001; n.s., not significant, by the Student t test.

