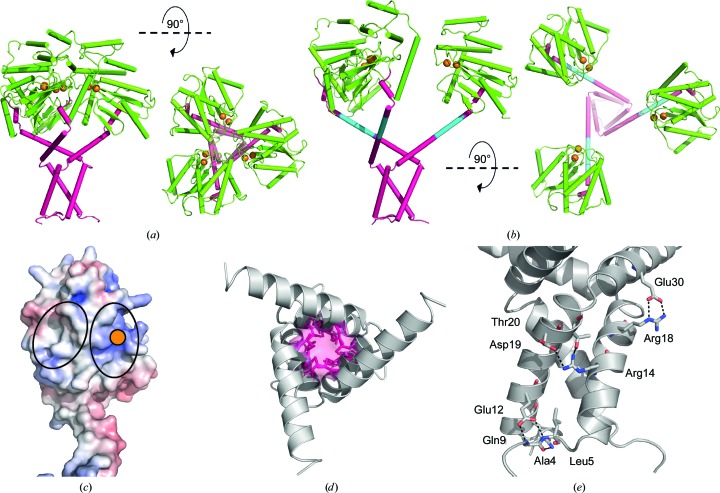
Figure 6.
Trimerization of PmScsCΔLinker. (a) Side and top views of the catalytic domain in the crystal structure of PmScsCΔLinker. The crystal structure reveals a trimer through crystallographic symmetry. In many respects this crystal structure resembles that of native extended PmScsC shown in (b) (PDB entry 5id4). However, the extended helix linking the trimerization domain to the catalytic domain is shorter in PmScsCΔLinker owing to deletion of the linker [cyan in (b)]. In both (a) and (b) the proteins are coloured using the scheme used in Fig. 1 ▸. (c) The electrostatic surface potential of the catalytic domain of the PmScsCΔLinker protomer structure. Electrostatic calculations were performed using APBS (Jurrus et al., 2018 ▸) and were contoured at −7.5 kT e−1 (red) and +7.5 kT e−1 (blue). A solid orange circle indicates the position of the catalytic cysteines; black ovals surround the regions of the catalytic domains in close contact with adjacent catalytic domains in the PmScsCΔLinker crystal structure. (d) The hydrophobic core of the trimerization stem of PmScsCΔLinker; side chains of residues contributing to the hydrophobic core are coloured pink. (e) Amino-acid residues mediating side-chain polar and electrostatic interactions between the trimerization stems of two PmScsCΔLinker protomers. Black dashed lines represent hydrogen bonds and the residues involved are labelled.

