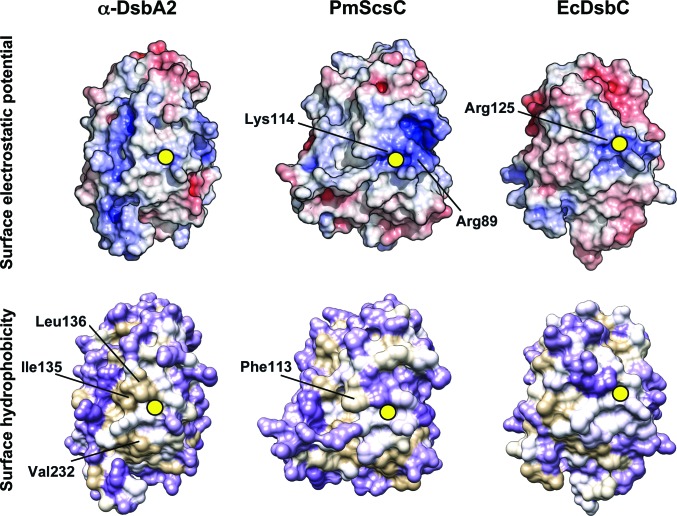
Figure 4.
Comparison of surface properties. Electrostatic surface potentials of α-DsbA2, PmScsC and EcDsbC (top panel). The calculation of electrostatic surface potentials employed the nonlinear Adaptive Poisson–Boltzmann Solver (APBS) and the PARSE partial atomic charges and radii. Electrostatic surface potentials were contoured between −6 kT e−1 (red) and +6 kT e−1 (blue). The surface hydrophobicity of α-DsbA2, PmScsC and EcDsbC is presented in the bottom panel. The protein surface was mapped to the Kyte–Doolittle hydrophobicity scale from purple (most hydrophilic) to white to tan (most hydrophobic). The structures are arranged in a similar orientation to that of α-DsbA2 in Fig. 3 ▸(a). The position of the active-site cysteine is indicated by a yellow circle.

