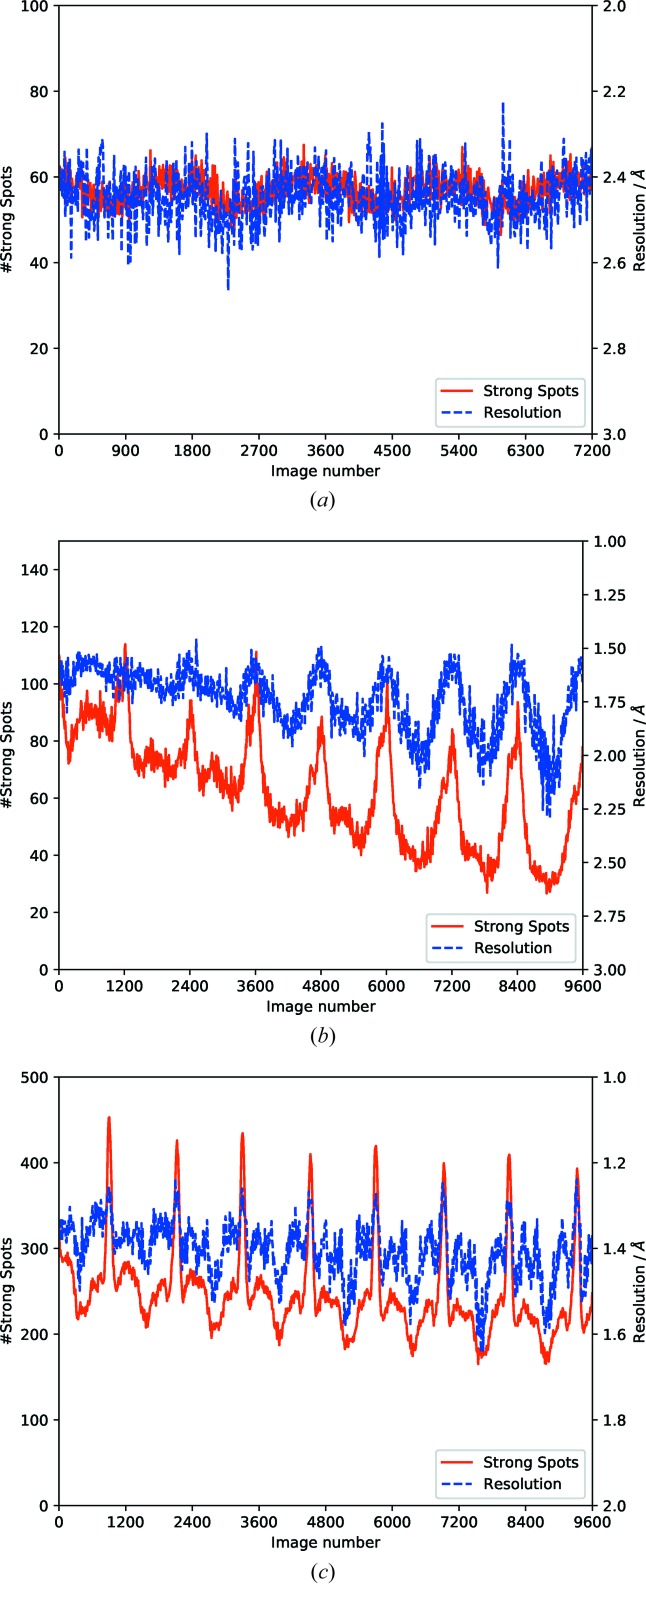
Figure 10.
Number of strong spots (red), and estimated resolution (blue), found per image for a number of different samples with varying degrees of radiation damage. (a) The first sweep of the weak thermolysin data; though there are some details resulting from the unit-cell dimensions and changes in illuminated volume, the overall trend is level. (b) A sample of BRD4, deliberately radiation damaged to indicate the fall off in resolution (blue) and number of strong spots (red). The sinusoidal pattern results from variations in illuminated volume. (c) A sample of CDK2, showing a less severe decrease in the strength of diffraction. Once again the ‘shape’ of the curve of strong spots depends on the sample morphology and unit cell.

