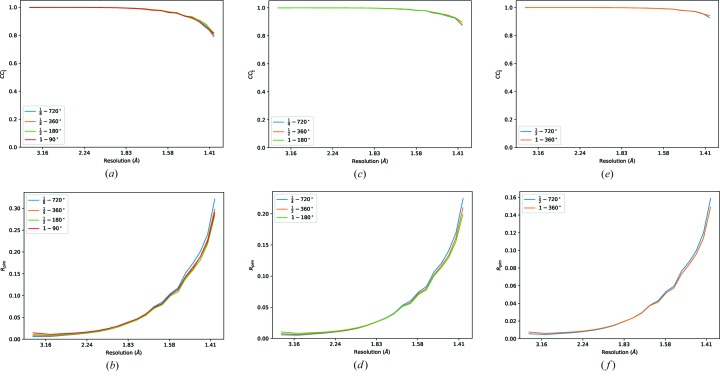
Figure 5.
Merging statistics for data derived from the first insulin crystal, with digital transmission applied. The data are indexed by the transmission factor from 1 to  (i.e. equivalent photon flux from 3.1 × 10¹¹ to 3.9 × 10¹⁰ photons s−1) and the total rotation included (i.e. all 720°, first 360°, 180° and 90° of the data). Data sets included in each plot are in principle comparable, as the product of the rotation and transmission factor is constant.

