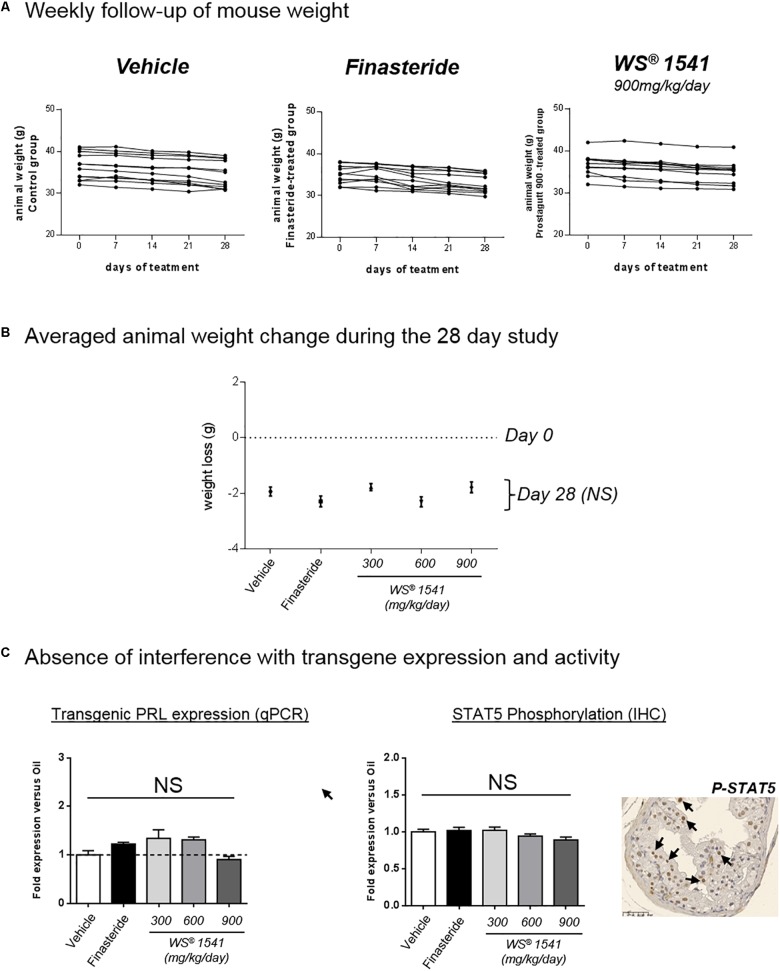
FIGURE 1.
Treatment tolerance and validation. (A) The weight of each animal (g) was measured at 0, 7, 14, 21, and 28 days of treatment. Each curve represents one single animal, n = 11–12 animals per group. (B) Averaged animal weight change in each treatment group between day 0 (dotted line) and sacrifice at day 28 of treatment (black dots). No significant (NS) difference was observed for any treatment group compared to vehicle (Mann–Whitney test). (C) Evaluation of the PRL/STAT5 pathway in all groups. Left: the mRNA expression of the rPRL transgene was determined by qPCR in the three lobes. Results of dorsal lobe are shown as fold expression vs. vehicle group. Right: the level of STAT5 activation in the various lobes and various treatment groups was analyzed by immunohistochemistry using anti-phosphorylated STAT5 antibodies. One typical image of dorsal lobe is shown (vehicle group), in which some nuclei positive for pSTAT5 are identified by black arrows. The ratio of STAT5-positive versus total nuclei in the epithelium was quantified as described in the section “Materials and Methods,” and the results of dorsal lobe are expressed as fold expression vs. vehicle group. ANOVA was used as statistical test followed by Tukey’s (n = 11–12 animals per group).

