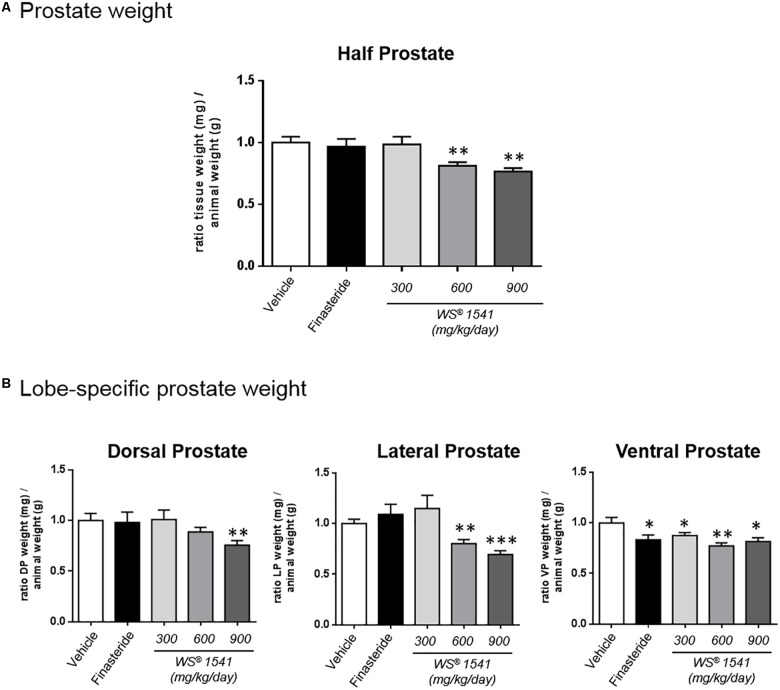
FIGURE 2.
Prostate weights. (A) Ratio between tissue weight of the half prostate (sum of the three lobes, mg) and the corresponding animal weight (g). Data are normalized to the control group (vehicle). (B) Lobe-specific effect of the various treatments as in panel A. Data are normalized to the vehicle group. Symbol: ∗ vs. vehicle group, ANOVA followed by Tukey’s.

