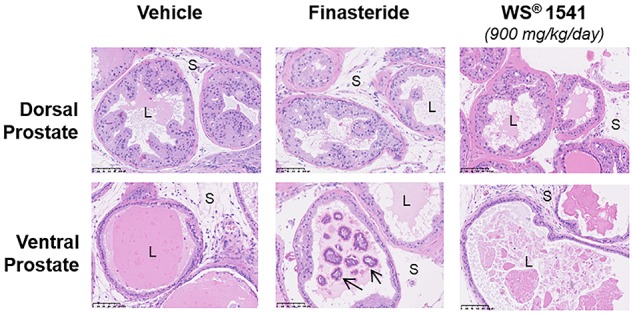
FIGURE 4.

Prostate histopathology. Representative images of dorsal and ventral prostate histology in the various treatment groups (magnification 20×). For WS® 1541 only the highest dose is shown as an example. Intraluminal mineralizations (identified by arrows) were frequently observed in the finasteride group. Symbols: S, stroma; L, lumen.
