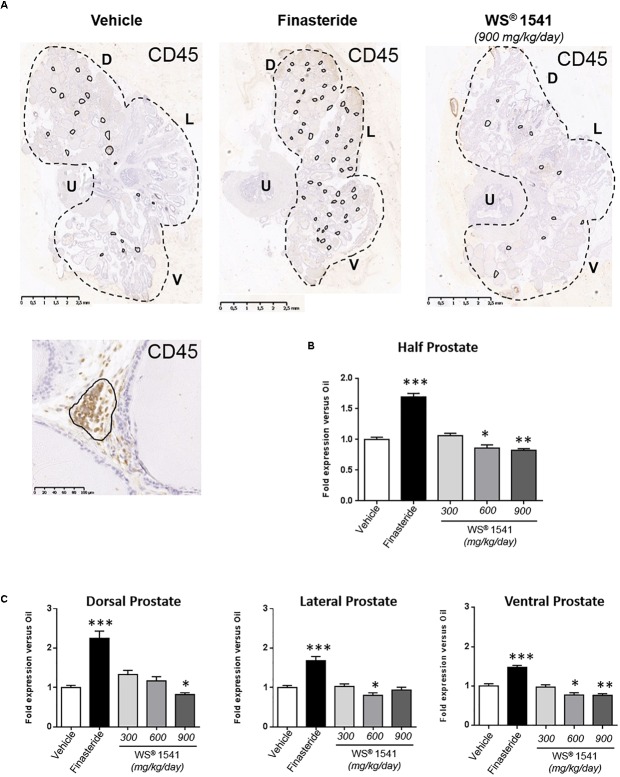
FIGURE 5.
Prostate inflammatory status. (A) Representative illustrations of CD45 immunostaining of half prostate sections from the various groups (only the highest dose is shown for WS® 1541). CD45-positive cell foci are circled in black, and one typical foci is shown at high magnification. The number of CD45-positive cell clusters was quantified for half prostate (B) and for each individual lobe (C) by image analysis as described in the section “Materials and Methods.” The results are normalized to the vehicle condition (see Table 1C for averaged crude values). Symbol: ∗ vs. vehicle group, ANOVA, followed by Tukey’s. D, dorsal prostate; L, lateral prostate; V, ventral prostate; U, urethra.

