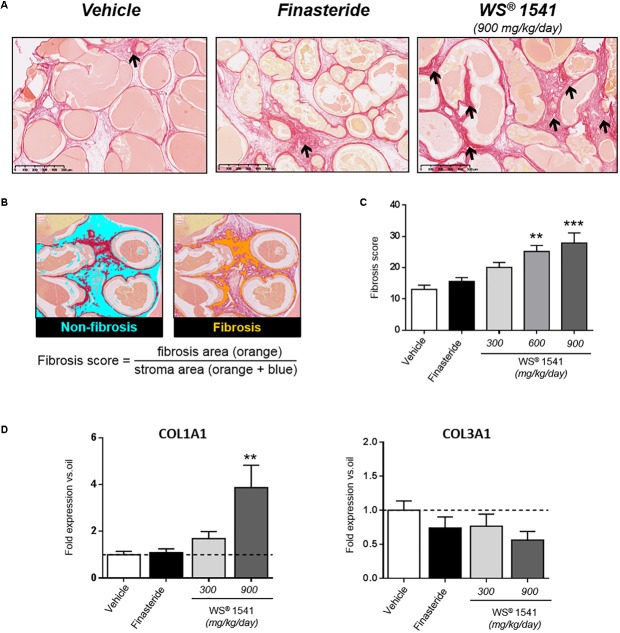
FIGURE 6.
Prostate fibrosis. (A) Representative images of picrosirius red staining showing stromal fibrosis in the ventral prostate. Arrows point to dense, isolated fibrotic stained foci in the vehicle- and finasteride-treated groups whereas staining is evenly distributed in the WS® 1541-treated groups, especially at the highest dose shown here. (B) Illustration of fibrosis score calculation by image analysis using Calopix® software (see the section “Materials and Methods” for explanations). (C) Fibrosis score in the various treatment groups. Symbol: ∗ vs. vehicle group, ANOVA, followed by Tukey’s, n = 11–12 per group. (D) Expression level of profibrotic genes COL1A1 and COL3A1 was assessed by RT-qPCR in ventral lobe. Results are expressed as fold expression vs. vehicle group.

