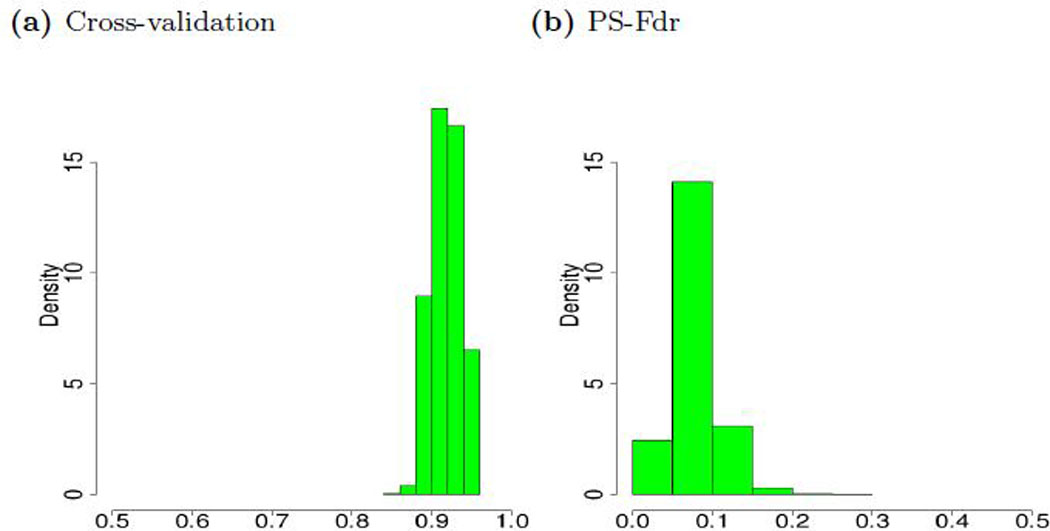
Fig. 1:

Histograms for the false discovery proportion (FDP). Figure 1a shows the histogram for the proportion of false discoveries for the Lasso with regularization parameters chosen by 10-fold (randomly repeat the procedure 10,000 times). Figure 1b shows the histogram for the proposed PS-Fdr procedure.
