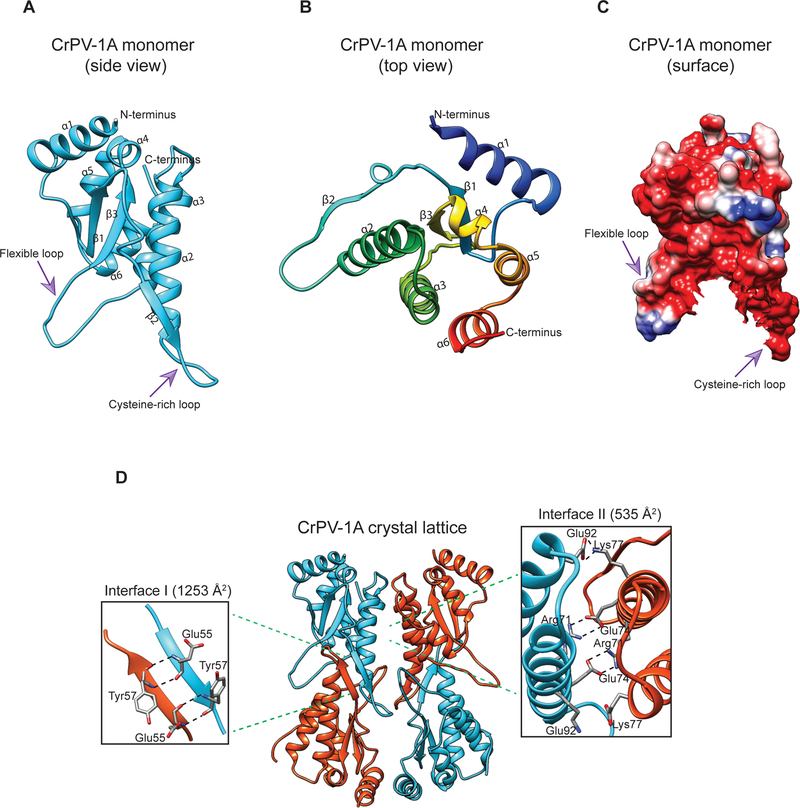
Fig 1: Overview of CrPV-1A structure.
(A, B) Side and top view of CrPV-1A monomer (C) Representation of the surface electrostatic potential in the CrPV-1A with negatively charged regions colored in red and corresponding positively charged regions is in blue. (D) Two adjacent monomers [monomer 1(cyan) and monomer 2(orange)] create two contact interfaces. Interface I is formed by hydrogen bonding between pairs of glutamic acids (Glu55) and tyrosine residues (Tyr57) on antiparallel beta strands. Interface II forms due to crystal contacts and is driven by hydrogen bonding between arginine 71 (Arg71) and glutamate 74 (Glu74) and electrostatic interactions (ES) between lysine 77 (Lys77) and glutamate 92 (Glu92).

