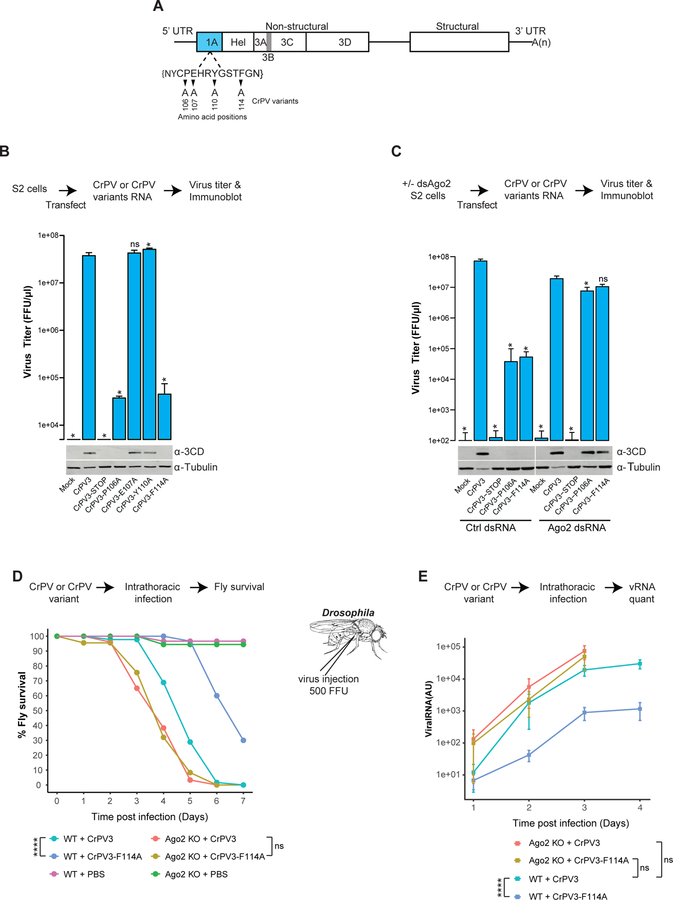
Fig 4: Importance of the TALOS element in virus pathogenesis.
(A) Schematic representation of the positions (small triangles) at which amino acid mutations were introduced into the CrPV3 infectious cDNA clone. (B) Viral titer by CrPV3 or CrPV3 variant RNA in S2 cells was measured by FFU assay. The synthesis of a viral protein and loading controls were visualized by a Western blot analysis using an antibody raised against CrPV 3CD peptides and tubulin, respectively. (C) Ago-2-depleted S2 cells were transfected with CrPV3, CrPV3-P106A, or CrPV3-F114A RNAs. Viral titer and expression of 3CD protein was measured by FFU assay and Western blot, respectively. Titer value in (B) and (C) represents the mean (±SD) of at three replicate experiments (n = 3). ns, not significant; *p<0.05 (Unpaired t test). The statistical significance represents measurement compared to CrPV3. One of two representative experiments (n = 2) is shown for Western blot analysis. (D) CrPV3 or CrPV3-F114A virus, or PBS were injected into flies (n = 10) of either WT or Ago-2 knockout background. Survival data represents mean of three independent experiments (n = 3). ns, not significant; *p<0.05; ****p<0.0001 (Log-rank test). (E) Viral RNA production in injected flies (panel D) was measured by qPCR. Each data point represents the mean (±SD) of three independent qPCR measurements (n = 3) using infected flies (n = 10). ns, not significant; *p<0.05; ****p<0.0001 (Generalized estimating equation test).

