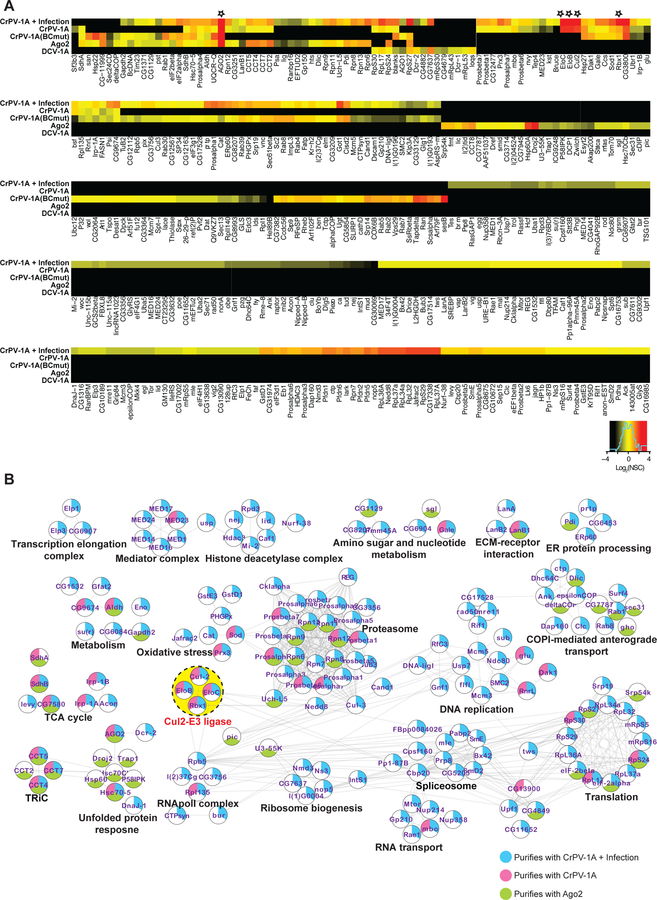
Fig 5: The interactomes of CrPV-1A and Ago-2 protein in S2 cells.
(A) For AP-MS experiments, a SaintScore threshold of 0.9, corresponding to a Bayesian False Discovery Rate (BFDR) of < 0.01, was used for reporting specific interactions. Heat map plots of most and least frequently observed interactors for a given bait protein in red and black, respectively. AP-MS experiment represents at least 3 biological replicates per bait protein (n = 3–5) (B) Networks for CrPV-1A, CrPV-1A+Infection, and Ago-2 interacting proteins depicting functionally associated protein clusters were generated using the String database (String Score Threshold = 0.9), and a layout was created using Cytoscape. The yellow dotted circle highlights the most prominent functionally associated protein interactions for CrPV-1A.

