Figure 1.
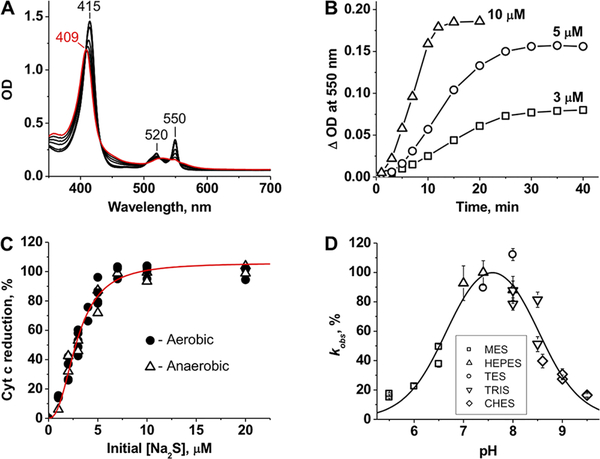
Reduction of Cyt C by sulfide. (A) The initial spectrum of ferric Cyt C (10 μM) in 100 mM HEPES buffer [pH 7.4 (red)] shifts in the presence of 10 μM Na2S (at 3, 5, 7, 10, 15, and 20 min, black lines) under aerobic conditions at 25 °C. (B) Kinetics of aerobic Cyt C reduction (10 μM) at 3, 5, and 10 μM Na2S in 100 mM HEPES buffer (pH 7.4) at 25 °C. (C) Percent Cyt C [10 μM in 100 mM HEPES buffer (pH 7.4)] reduction as a function of sulfide concentration. The increase in absorbance at 550 nm was monitored after incubation with sulfide at 25 °C for 1 h under aerobic or anaerobic conditions. The red line is a sigmoidal fit to the experimental data with an S0.5 of 2.9 ± 0.1 μM and an n of 2.4 ± 0.2. (D) pH dependence of Cyt C reduction by sulfide. The rate of Cyt C (2.5 μM) reduction by sulfide (500 μM) was determined by anaerobic stopped-flow spectroscopy as described in Methods. The data are the mean ± the standard deviation (SD) of four independent experiments as described in Methods. From the fit, estimates for pKa1 and pKa2 of 6.7 ± 0.1 and 8.5 ± 0.1, respectively, were obtained.

