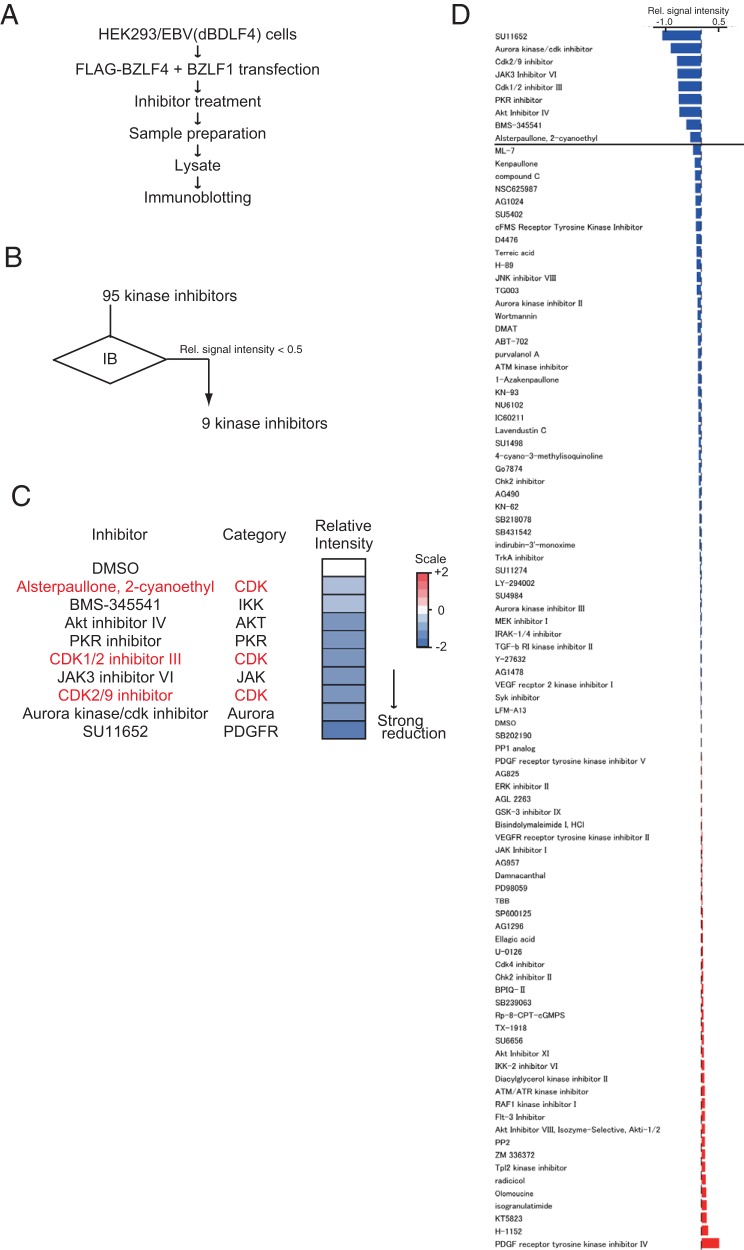
FIG 2.
Screen for kinase inhibitors downregulating BDLF4 expression. (A) Workflow of the screen. (B) Summary of screen data. IB, immunoblotting. (C) Heat map showing the levels of BDLF4 protein in cells treated with the indicated inhibitors. Signals higher than the baseline level are shown in red; signals lower than baseline are shown in blue. The numbers on the heat map key indicate log2-fold changes relative to the DMSO-treated control. (D) Immunoblot data derived using anti-FLAG and anti-GAPDH antibodies. Relative (Rel.) signal intensities are ratios of the FLAG band intensity to the GAPDH band intensity.

