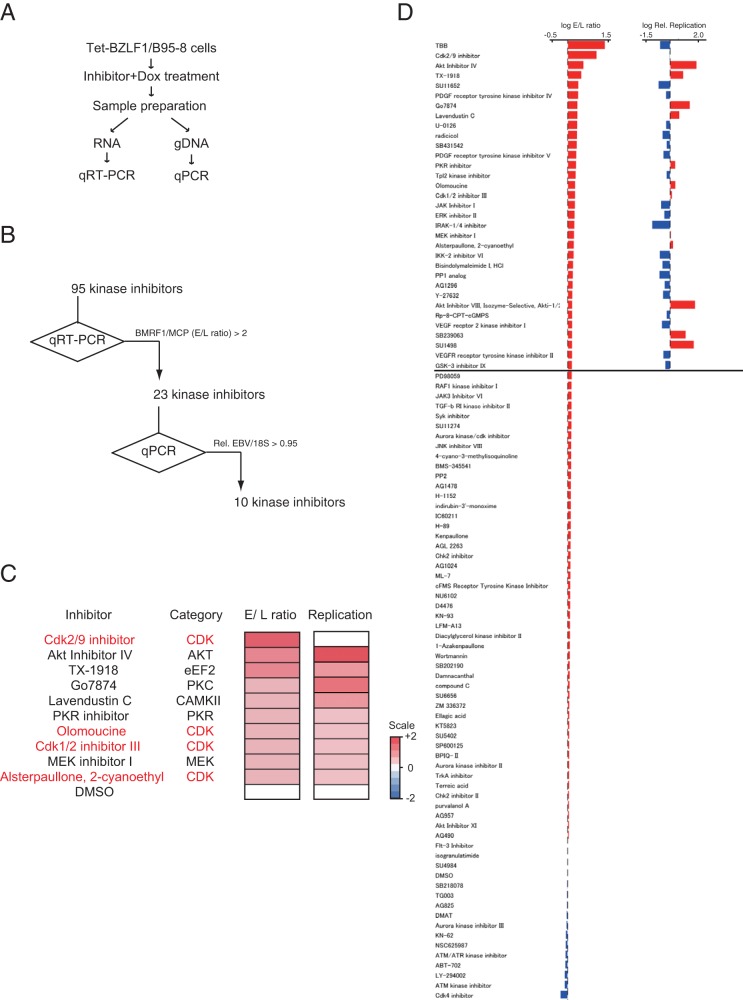
FIG 6.
Screening for kinase inhibitors that specifically inhibit EBV late gene expression but do not inhibit viral replication. (A) Workflow. (B) Summary results of the screen. (C) Heat map showing the viral early/late gene expression ratios and the extents of viral replication in B95-8 cells in which lytic replication was induced, followed by the addition of the indicated inhibitors. Signals higher than the baseline values are shown in red; signals lower than the baseline are shown in blue. The numbers on the heat map are log2-fold changes from the levels with DMSO alone. (D) qPCR analyses of viral mRNA (left) and DNA (right) levels. Bars represent the log fold changes in E/L ratios (BMRF1/MCP expression levels) (left) and relative replication levels (normalized to those for the DMSO controls) (right). Rel., relative.

