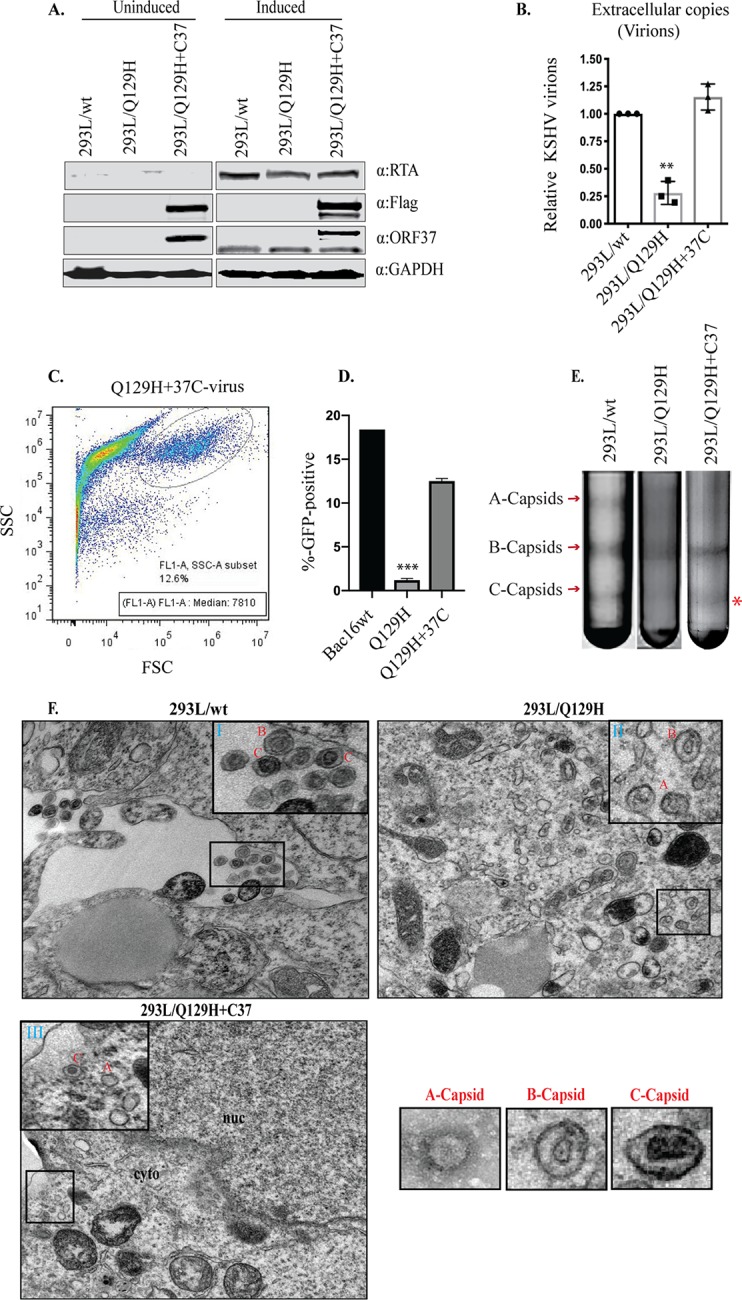
FIG 4.

The exogenous expression of ORF37 protein rescued the ORF37-defective phenotype. (A) Western blot analysis of protein extracts from uninduced and 48-hpi 293L/wt, 293L/Q129H, and 293L/Q129H+C37 cells indicated equivalent RTA and ORF37 expression levels in 293L/wt, 293L/Q129H, and 293L/Q129H+C37 cells and confirmed the ORF37-wt trans-complementation as evidenced by Flag expression for 293L/Q129H+C37 cells. (B) Quantitation of extracellular virions in supernatants from 5-dpi 293L/wt, 293L/Q129H, and 293L/Q129H+C37 cells by qPCR assay displayed an increase in virion production in 293L/Q129H+C37 supernatants over 293L/Q129H supernatants, indicating a partial rescue of the defective Q129H phenotype. Mean values and standard deviations from the results of three independent experiments are presented. **, P < 0.01. (C and D) HEK293L cells infected with 293L/Q129H+C37 virus supernatants were assayed by flow cytometry 2 days postinfection (data for 293L/wt and 293L/Q129H are also shown for reference). The side scatter (SSC) versus forward scatter (FSC) plot to identify the GFP-positive cells/signals measured at high fluorescence indicates higher levels of KSHV virions in 293L/Q129H+C37 virus supernatant than in 293L/Q129H supernatants. Mean values of the percentages of infected cells from the results of three independent experiments are plotted. ***, P < 0.001. (E) Analysis of KSHV capsids in 5-dpi 293L/wt, 293L/Q129H, and 293L/Q129H+C37 virus supernatants purified by sucrose gradient ultracentrifugation indicated equivalent amounts of light-refracting A/B/C capsid bands in 293L/wt and 293L/Q129H+C37 supernatants versus 293L/Q129H supernatants. (F) Electron micrographs of 72-hpi 293L/wt, 293L/Q129H, and 293L/Q129H+C37 cells carrying various recombinants displayed more immature nucleocapsids (B capsids) (inset II) in 293L/Q129H cells than in 293L/wt and 293L/Q129H+C37 cells. 293L/Q129H+C37 cells showed DNA-filled nucleocapsids (C capsids) with electron-dense cores (inset III) similar to the 293L/wt cells (inset I). Extracellular virions were not visible. Representative images of individual A, B, and C capsids are shown separately. cyto, cytoplasm; nuc, nucleus; inset bar = 200 nm.
