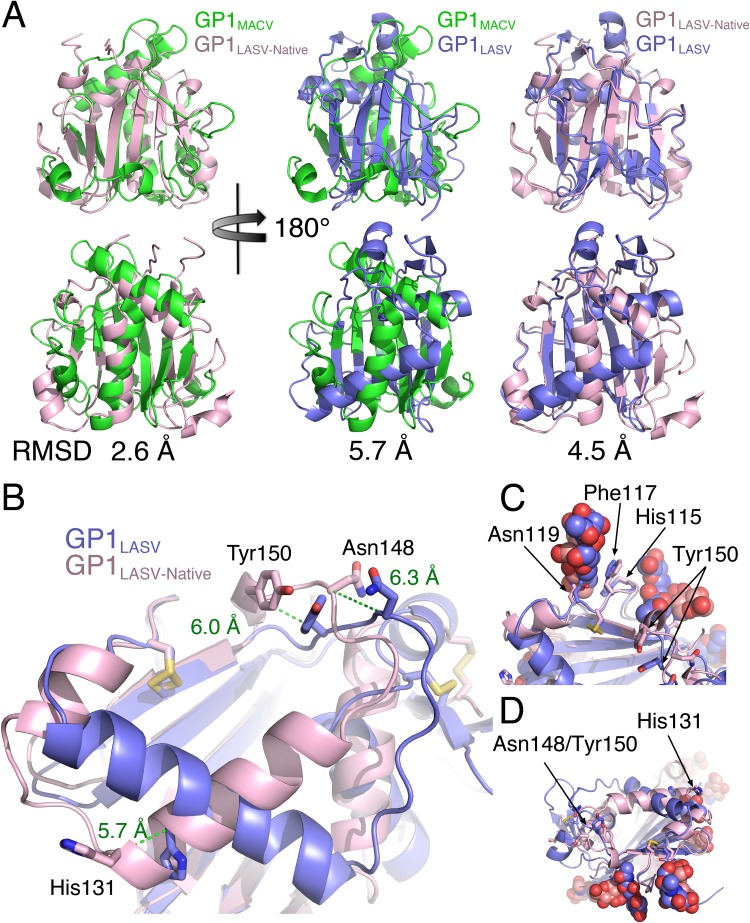
FIG 5.
Structural comparison of soluble GP1LASV with GP1LASV of GPC in the native conformation (GP1LASV-Native). (A) Superpositions of GP1LASV-Native (pink; PDB accession number 5VK2) with soluble GP1LASV (blue; PDB accession number 4ZJF) and GP1MACV (green; PDB accession number 2WFO). The views in the lower row are rotated 180° compared to the views in the upper row. Root mean square deviation (RMSD) values that were calculated using the TM-align server (45) are indicated for each pair of aligned structures. (B) A close-up view of GP1LASV-Native superimposed with GP1LASV showing His131, Asn148, and Tyr150 as sticks. Green dotted lines illustrate the relative C-α atom movements of the indicated residues in the two aligned structures, and the distances are indicated in ångströms. (C) A glycan attached to Asn119 masks a conformation-stable region. Phe117 and His115, which maintain the same conformation in both GP1LASV-Native and GP1LASV, are shown as sticks. Glycans are shown using spheres. The color scheme is the same as that in panel A. (D) The regions that make the α-DG binding site are devoted from glycans. The two regions that form the α-DG binding site are indicated, as are the observed glycans. The color scheme is the same as that described in the legend to panel A.

