FIG 6.
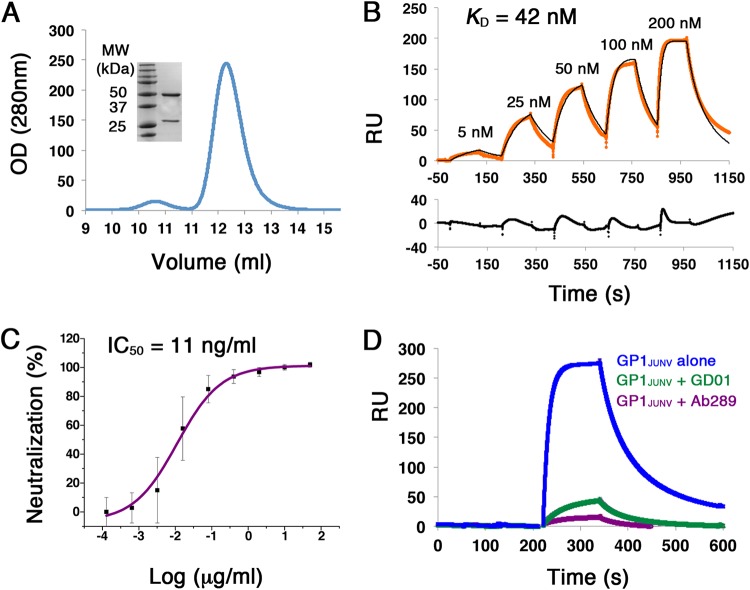
Isolation and characterization of Ab289 from GP1JUNV-immunized mouse serum. (A) Chromatogram showing the elution profile of Ab289 using SEC. OD, optical density. (Inset) SDS-PAGE analysis of Ab289 stained with Coomassie blue. (B) SPR sensorgram of GP1JUNV as the analyte injected over immobilized Ab289 in a single-cycle kinetic experiment. The recorded sensorgram is shown in orange, and the fitted graph is shown in black. KD was calculated by fitting a 1:1 binding model to the experimental data. A residual plot showing the quality of the fitted models is included below the sensorgram. The binding experiment was repeated twice, and a representative sensorgram is shown. (C) Neutralization IC50 plot of JUNV-pseudotyped viruses by Ab289. The neutralization was tested using a 5-fold dilution series of Ab289. No Ab control was used to determine 100% infectivity. The IC50 was calculated to be 11 ng/ml using a four-parameter sigmoidal function. The indicated values are averages from three independent experiments, each containing several technical replicates. Error bars show standard deviations. (D) Competition SPR experiments. GP1JUNV was injected as the analyte at 200 nM over immobilized Ab289 either alone (blue) or in the presence of 1 μM Fab 289 (purple) or 1 μM Fab GD01 (green) as competitors.

