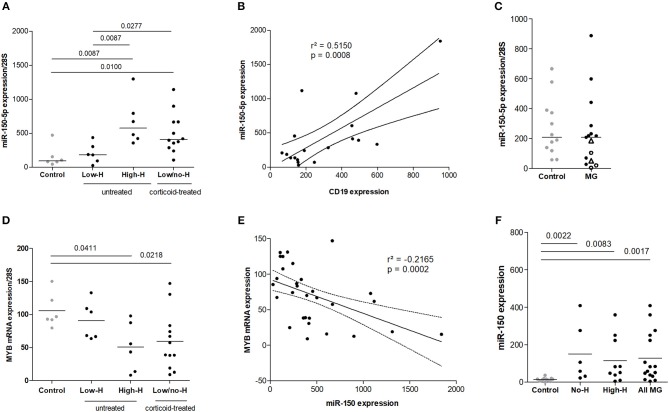
Figure 1.
Increased expression of miR-150–5p associated with thymic hyperplasia in MG. (A) miR-150 expression in the thymus of non-MG controls (n = 6), MG patients with a low degree of thymic hyperplasia (Low-H, n = 6) or with a high degree of thymic hyperplasia (High-H, n = 6) and in corticoid-treated MG patients displaying low or no hyperplasia (Low/no-H; n = 12). miR-150 expression was normalized on 28 S expression. (B) Correlation analysis of miR-150 and CD19 mRNA expression in the thymus of controls (n = 6) and untreated MG patients (n = 12) (C) miR-150 expression in medullary thymic epithelial cells from non-MG adults (n = 12) and untreated MG patients (n = 15). Thymic epithelial cells from High-H MG patients are represented with empty black dots and cells from patients undergoing corticoid therapy at the time of thymectomy are represented as empty black triangles. (D) MYB mRNA expression in controls (n = 6), untreated MG patients (Low-H, n = 6; High-H, n = 6) and corticoid-treated MG patients (Low/no-H, n = 12). mRNA expression was normalized on 28S expression. (E) Negative correlation analysis of miR-150 and MYB mRNA expression in the thymus of controls (n = 6), untreated (n = 12) and cortico-treated MG patients (n = 12). (F) miR-150 expression in the serum of controls (n = 11), MG patients without thymic hyperplasia (No-H; n = 6) and MG patients with a high degree of thymic hyperplasia (High-H, n = 10). No-H and High-H patients were pooled for the “All MG” category. P-values were assessed by the Mann-Whitney test and only p-values < 0.05 are indicated on the graphs. Pearson's correlation was assessed and determination coefficient and p-values are indicated on the graphs.

