
Figure 4.
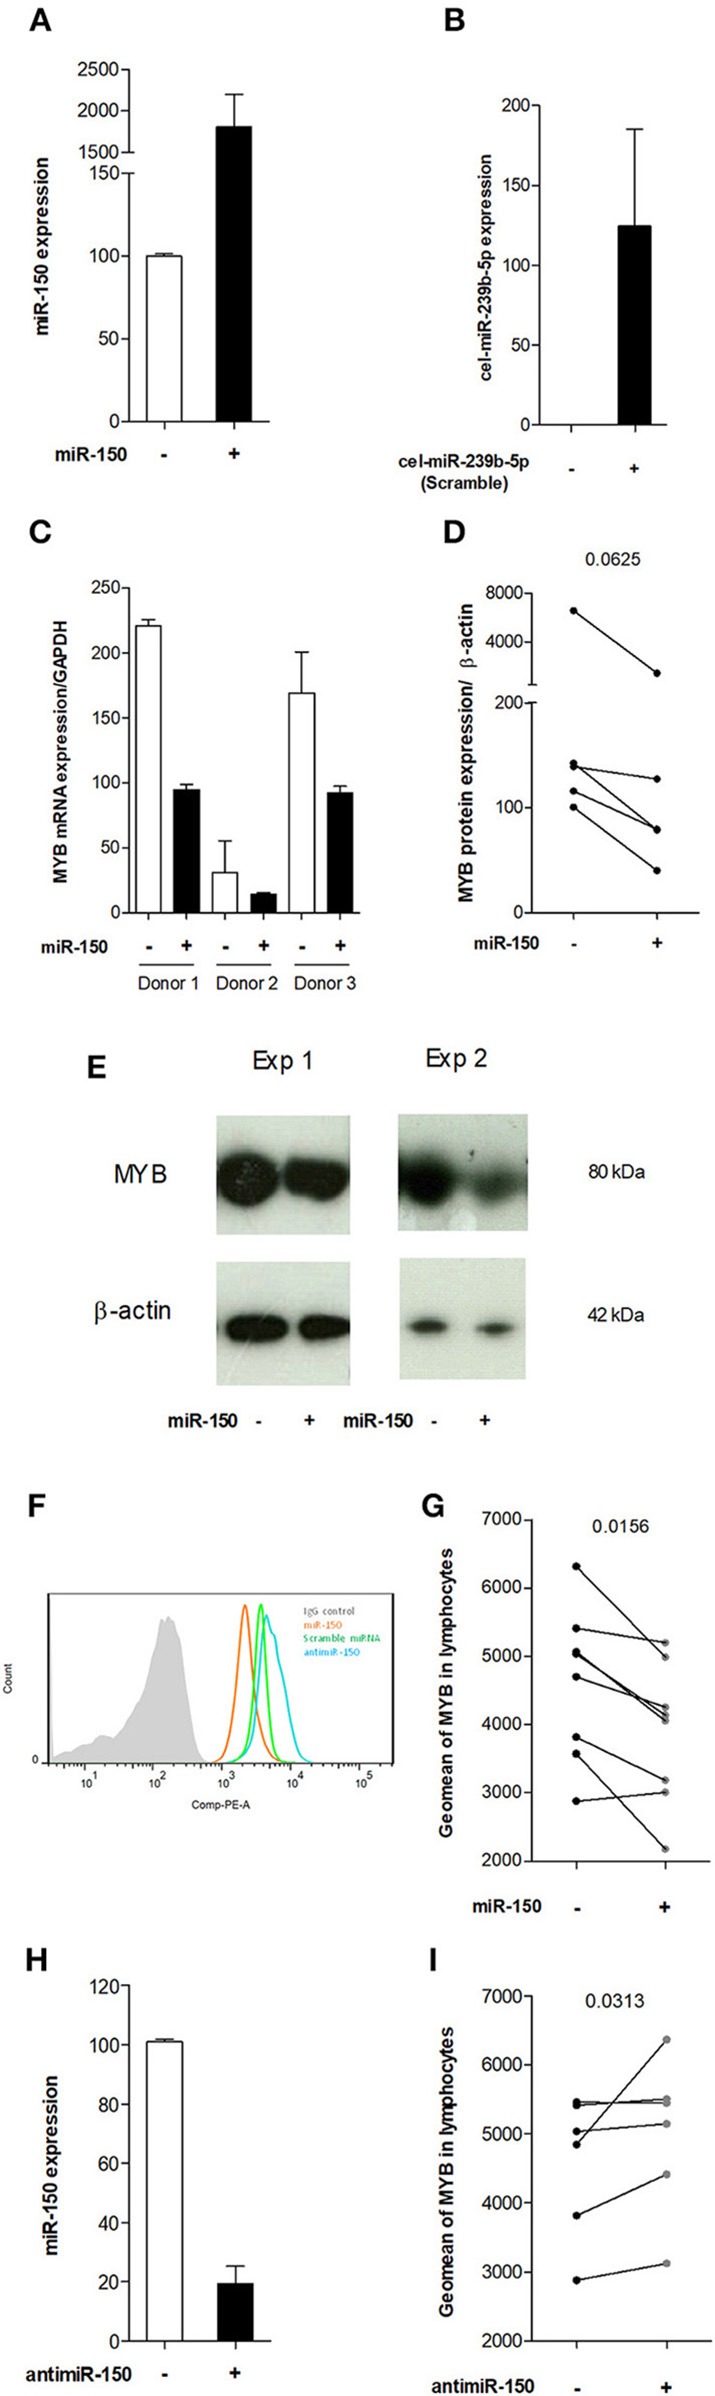
miR-150-5p decreased MYB expression in peripheral blood cells in vitro. (A) Representative experiment of miR-150 expression in PBLs treated with a scramble miRNA (-) or miR-150 (+). (B) Representative experiment of cel-miR-293b expression (scramble miRNA) in PBLs treated with miR-150 (-) or a scramble miRNA (+). (C) PCR analysis of MYB mRNA expression in PBLs treated with a scramble miRNA (-) or miR-150 (+) in 3 different donors. MYB mRNA expression was normalized on GAPDH mRNA expression. (D,E) Western blot analyses of MYB protein expression in PBLs treated with a scramble miRNA (-) or miR-150 (+). (D) Western blot quantitative analyses of MYB protein in 5 different donors. MYB expression level was normalized on β-actin. (E) Two representative experiments of MYB and β-actin protein expression as seen after Western blot revelation in two different donors. Protein sizes are indicated next to respective bands (F) Representative experiment of MYB expression in PBLs treated with miR-150 (orange), scramble miRNA (green) or antimiR-150 (blue), assessed by flow cytometry. Control IgG is represented as a full grey histogram. Cells were first gated for singlet on FSC-H vs. FSC-A, and further analyzed according to their uptake of Live/Dead stain. Finally, lymphocytes were gated on SSC-A vs. FSC-A. (G) Geomean of MYB expression in the lymphocyte population (n = 8), treated with a scramble miRNA (-) or miR-150 (+). (H) Representative experiment of miR-150 expression in PBLs treated with a scramble miRNA (-) or antimiR-150 (+). (I) Geomean of MYB expression in the lymphocyte population (n = 6), treated with a scramble miRNA (-) or antagomiR-150 (+). (D,G,I) p-values were assessed by the Wilcoxon paired test.