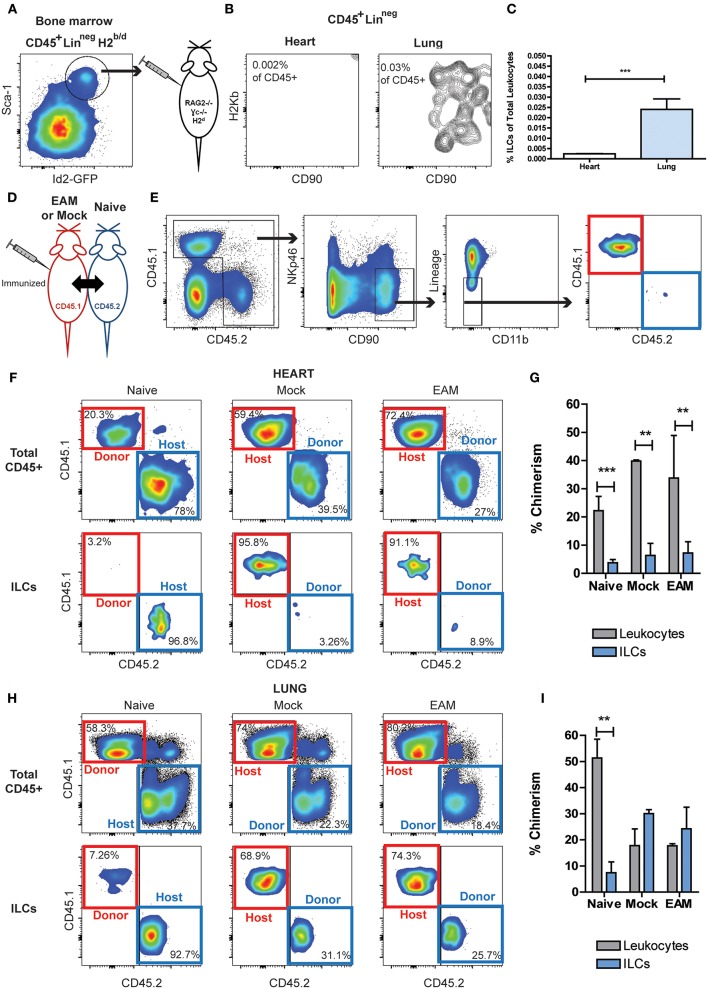
Figure 6.
Circulating ILCs cannot infiltrate heart tissues. (A) FACS sorting strategy of bone marrow ILC progenitors, CD45+LineagenegId2+Sca1+, transferred into RAG2−/−γc−/−. (B) Flow cytometry plots of infiltrating H2Kb ILCs in heart and lung. (C) Bar graphs comparing the detectable infiltrating ILC population in heart and lung. (D) Scheme of parabiosis experiment. (E) Gating strategy used to analyze ILC population at the peak of EAM, using a naïve parabiont as representative example. In naïve pairs the infiltrating ILCs were CD45.1 (red boxes), and in Mock and EAM pairs the infiltrating ILCs were CD45.2 (blue boxes). (F) Flow cytometry plots showing the source of leukocytes and ILCs in heart. (G) Bar graphs comparing the proportion of infiltrating ILCs and leukocytes in heart. (H) Flow cytometry plots showing the source of leukocytes and ILCs in lung. (I) Bar graphs comparing the proportion of infiltrating ILCs and leukocytes in lung tissues. Naïve n = 8, EAM n = 3, Mock n = 2. Bar graphs shows Mean and SD. Statistics were calculated with Student t (C) and one-way ANOVA and Bonferroni post-test (G–I). **P < 0.01, ***P < 0.001.

