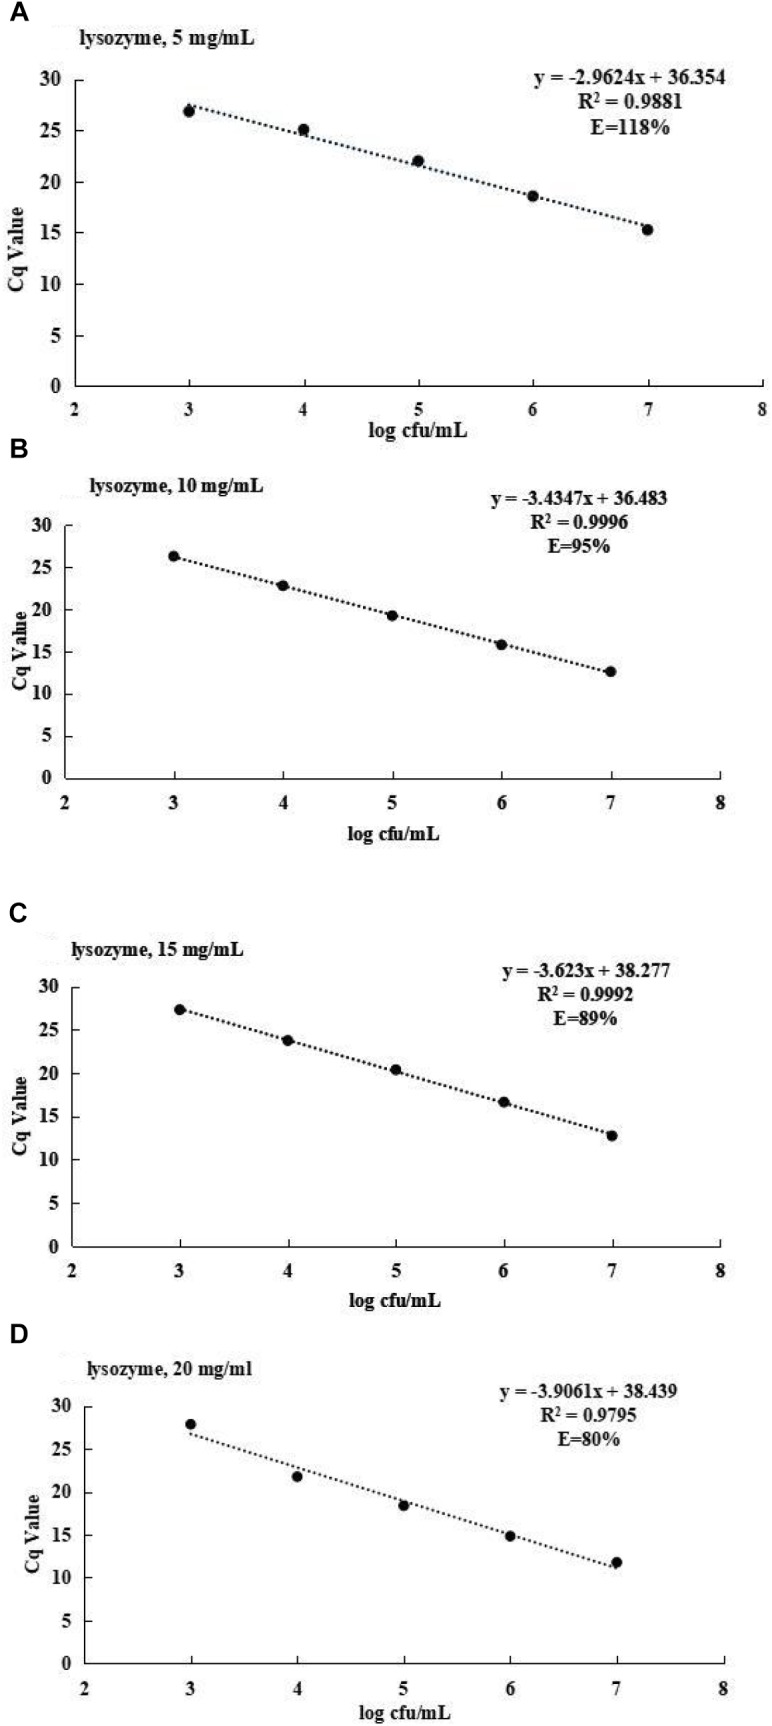
FIGURE 2.

(A) The standard curve for S. agalactiae at 5 mg/ml of lysozyme. (B) The standard curve for S. agalactiae at 10 mg/ml of lysozyme. (C) The standard curve for S. agalactiae at 15 mg/ml of lysozyme. (D) The standard curve for S. agalactiae at 20 mg/ml of lysozyme.
